Robust Estimators
Robust Estimators. Estimating Population Parameters. The mean (X) and variance (s 2 ) are the descriptive statistics that are most commonly used to represent the data points of some sample.

Robust Estimators
E N D
Presentation Transcript
Estimating Population Parameters • The mean (X) and variance (s2) are the descriptive statistics that are most commonly used to represent the data points of some sample. • The real reason that they are the preferred measures of central tendency and variance is because of certain properties they have as estimators of their corresponding population parameters; and 2.
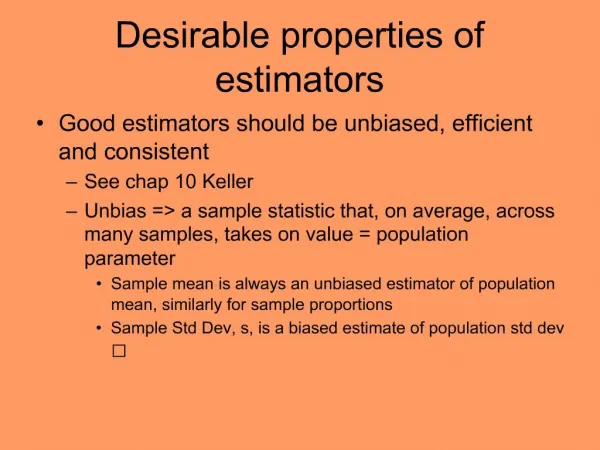
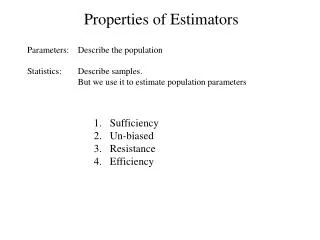
Estimating Population Parameters (cont.) • Four properties are considered desirable in a population estimator; sufficiency, unbiasedness, efficiency, & resistance. • Both the mean and the variance are the best estimators in their class in terms of the first three of these four properties. • To understand these properties, you first need to understand a concept in statistics called the sampling distribution
Sampling Distribution Demo • Basically, the idea is this – in order to examine the properties of a statistic we often want to take repeated samples from some population of data and calculate the relevant statistic on each sample. We can then look at the distribution of the statistic across these samples and ask a variety of questions about it. • Check out this demonstration
Properties of a Statistic • 1) Sufficiency A sufficient statistic is one that makes use of all of the information in the sample to estimate its corresponding parameter. For example, this property makes the mean more attractive as a measure of central tendency compared to the mode or median.
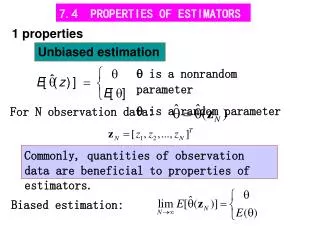
Estimating Population Parameters • 2) Unbiasedness A statistic is said to be an unbiased estimator if its expected value (i.e., the mean of a number of sample means) is equal to the population parameter it is estimating. • Using the resampling procedure, the mean can be shown to be an unbiased estimator.
Assessing the Bias of an Estimator Explanation of N-1 in s2 formula. • If the more intuitive formula for s2 is used: • it turns out to underestimate 2
Assessing the Bias of an Estimator (cont.) • This bias to underestimate is caused by the act of sampling and it can be shown that this bias can be reduced if N-1 is used in the denominator instead of N. • Note that this is only true when calculating s2, if you have a measurable population and you want to calculate 2, you use N in the denominator, not N-1.
Degrees of Freedom • The mean of 6, 8, & 10 = 8. • If I allow you to change as many of these numbers as you want BUT the mean must stay 8, how many of the numbers are you free to vary?
Degrees of Freedom • The point of this exercise is that when the mean is fixed, it removes a degree of freedom from your sample -- this is like actually subtracting 1 from the number of observations in your sample. • It is for this reason that we use N-1 in the denominator when we calculate s2 • The calculation requires that the mean be fixed first which effectively removes -- fixes -- one of the data points.
Estimating Population Parameters • 3) Efficiency The efficiency of a statistic is reflected in the variance that is observed when one examines the statistic over a bunch of independently chosen samples. The smaller the variance, the more efficient the statistic is said to be.
Estimating Population Parameters • 4) Resistance The resistance of an estimator refers to the degree to which that estimate is effected by extreme values. As mentioned previously, both X and s2 are highly sensitive to extreme values.
Estimating Population Parameters • 4) Resistance Despite this, they are still the most commonly used estimates of the corresponding population parameters, mostly because of their superiority over other measures in terms sufficiency, unbiasedness, & efficiency. However…
J. W. Tukey “Statistics is a science in my opinion, and it is no more a branch of mathematics than are physics, chemistry and economics; for if its methods fail the test of experience – not the test of logic – they will be discarded”
Outline • Different measures • trimmed mean, winsorized mean, M-estimators • Median absolute deviation • Estimation • Bootstrap (a re-sampling procedure) • End result • Increase your chances of getting significant results
Two (sometimes) related questions • What is the best measure to estimate for the scientific purpose? • Mean v median • What is the best way to measure the estimate?
These question both concern robustness, but each concern something else: Which measure: measurement level and meaningfulness of a statistic. How measured: the distribution of the data
Robust Estimation • What is Robust? • Influence plots, breakdown points (resistance) • Robust Estimators • Trimmed, winsorized, and the M-Estimators • Computer intensive methods • The bootstrap • Mostly on central tendency, but briefly on others.
What to measure: Central Tendency How many hours of TV watched yesterday
Trimmed Mean 1 2 2 2 3 3 3 3 3 3 4 4 4 4 4 5 5 6 8 10 2 2 2 3 3 3 3 3 3 4 4 4 4 4 5 5 6 8 • Simply cut off the ends • Example: 10% trim • N=20 • Cut out 2 values (10%), lowest and highest • Mean = 3.95 • Median = 3.50 • 10% trimmed mean = 3.78
Winsorized Mean 1 2 2 2 3 3 3 3 3 3 4 4 4 4 4 5 5 6 8 10 2 2 2 2 3 3 3 3 3 3 4 4 4 4 4 5 5 6 8 8 • Make some percentage of most extreme values the same as the previous value • Doing this to 10% of our data… • = 3.90
M-Estimators • More mathematically complex, but that’s what computers are good for • Calculate the center of the distribution and give less weight to values that are further away from center • Different M-Estimators give different weights for deviating values
All together now • Mean = 3.95 • Median = 3.50 • 10% trim mean = 3.78 • 10% Winsorized = 3.90 • Huber’s = 3.51 • Tukey’s s = 3.33 • Hampel’s = 3.37 • Andrew’s = 3.33
S vs. AD vs. Median Absolute Deviation • MAD = the median absolute deviation from the median • Efficiency: MAD > s > AD • s vs. AD • For normal distribution AD = .8(s) • Turns out the efficiency advantage of s over AD is nullified and even reversed for even slightly less than normal data.
MAD • For normal distribution .67(s) or .85(AD) • More efficient than either s or AD • Also more resistant than either • Tukey • MAD “the best of an inferior lot”
Classical Statistics • Parameter Estimates (“Point” Estimates) • Sample mean and sample standard deviation • Sample correlation and covariance estimates • Linear least squares model fits • Statistical Inference • t-statistic and t-interval for an unkown mean • Standard errors and t-values for regression coefficients • F-tests for regression model hypotheses
Classical stats are often not robust Outliers have “unbounded influence” on classical statistics, resulting in: • Inaccurate parameter estimates and predictions • Inaccurate statistical inference • Standard errors are too large • Confidence intervals are too wide • t-statistics lack power • In short, unreliable when outliers are present
Resistance • A Fundamental Continuity Concept - Small changes in the data result in only small changes in estimate • “Change a few, so what” J.W. Tukey • Valuable Consequence - A good fit to the bulk of the data - Reliable, automatic outlier detection
J. W. Tukey (1979) “… just which robust/resistant methods you use is not important – what is important is that you use some. It is perfectly proper to use both classical and robust/resistant methods routinely, and only worry when they differ enough to matter. But when they differ, you should think hard.”
Bootstrap • More voodoo • The basic idea involves sampling with replacement to produce random samples of size n from the original data • Each of these samples provides an estimate of the parameter of interest. • Repeating the sampling a large number of times provides information on the variability of the estimator.
Bootstrap • From previous data example • 1000 samples • Distribution of Means of each sample • Mean = 3.94
Bootstrap • With smaller data sets we should be concerned about biasedness • Does our statistic reliably estimate the population parameter? • Bootstrapped estimates and subsequent inferential use may be preferable in such low N situations