Download
1 / 27
280 likes | 591 Vues
Measures of Dispersion and Standard Scores. Deviation Review. Deviation is the difference from a standard or reference value (usually the mean). This is the starting point for determining both the variance and the standard deviation of a set of scores.

E N D
Deviation Review • Deviation is the difference from a standard or reference value (usually the mean). • This is the starting point for determining both the variance and the standard deviation of a set of scores. • We want to measure the dispersion of the scores around the mean, so it makes sense to use the deviation scores.
Activity #1 (Part 1) • Measure to the nearest millimeter the writing utensil you are using and write the measurement on a piece of paper.
Sum of Squares (SS) • Sum of squares = sum of squared deviations • SS is used when calculating the variance and the standard deviation • If you are using a frequency distribution table:
Sum of Squares (SS) • The population formulas are as follows:
Calculating SS • Step 1: Find the mean. • Step 2: Find the deviation scores. • Step 3: Square the deviation scores. • Step 4: Sum the squared deviation scores.
Sum of SquaresComputational Formulas • When you are trying to understand SS, use the previous formulas, but when you are computing SS, use these formulas (it’s faster).
Watch Out • Know the difference between and . • means that you square Xs, then sum the squared Xs. • means that you sum the Xs, then square the sum of the Xs.
Calculating SS (the easy way) • Step 1: Sum the X column and square the sum. • Step 2: Square each score (X) • Step 3: Sum the X2 column. • Step 4: Plug the values into the formula and solve.
Calculating SS with Frequency Distribution Tables • Step 1: Create a fX column and sum the values, then square the sum. • Step 2: Create a fX2 column by multiplying fX(X) (do not square fX). • Step 3: Sum the fX2 column. • Step 4: Plug the values into the equation and solve (remember N is the sum of f).
Population Variance (σ2) • Variance = average of squared deviations • Recall that SS is the sum of the squared deviations, the numerator in the above equation. So we can rewrite the equation as:
Sample Variance (s2) • If we use the population formula for sample data, we will probably underestimate the variance (i.e., s2 will be smaller than σ2). • To correct for this and get a better estimate of the population variance, we change the denominator to N-1.
Sample Variance (s2) • When you use N-1 in the denominator, the result is a larger estimate of the population variance. • Why do we need to make our estimate larger? • (Unadjusted) sample variance is always less than or equal to population variance.
Standard Deviation • The standard deviation is the square root of the variance.
Calculation: Break it Down Sum of Squares (SS) Variance (s2)
Know These Equations With these three equations you can understand and calculate sample variance and standard deviation.
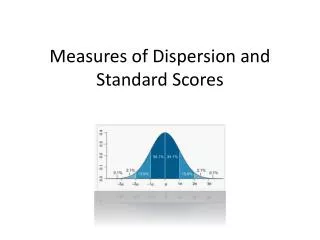
What Does it Look Like? • Let’s look at an example (also see p. 103): • The standard deviation is another unit of measurement on the X axis.
What Should We Expect? • For a small sample, we should expect the standard deviation units to divide the sample distribution into about 4 parts. • For a large sample, we should expect closer to six parts.
Activity #1 (Part 2) • Given our writing utensil data, calculate (in the following order): • SS • s2 • s • Use either of the sample formulas and show all of your work. • Write your name on the paper.
Standard Scores (z scores) • z score = the deviation of a raw score from the mean in standard deviation units. • The closer a score is to the mean, the smaller its z score will be. • A positive z-score indicates that the score is above the mean, negative indicates that it is below the mean. A z score of zero will always be at the mean.
You Try • What raw score would have a z score of -1? 82 72 62 52
You Try • What raw score would have a z score of 2? 82 92 102 112
Calculating z scores • Population: • Sample: • So you have to know the standard deviation and the mean before you can find the z score.
Calculating Raw Scores • If I know the z score but I don’t know the corresponding raw score, using basic algebra I can change the equation to solve for X.
Activity #2 • Given the above information, calculate the z score values for the following raw scores: 75, 95, 100, 50, 125, and 80. • Using the same sample information, calculate the raw scores for the following z scores: 3.25, -.25, 2, -1.75, and 2.5
Homework • Study for Chapter 6 Quiz (know the equations in red). • Read Chapter 7 • Do Chapter 6 Homework


