Download
1 / 32
320 likes | 534 Vues
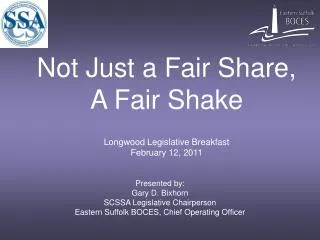
Not Just a Fair Share, A Fair Shake and A Fair Chance at Sustainability Spring 2011. Presented by: Gary D. Bixhorn SCSSA Legislative Chairperson Eastern Suffolk BOCES, Chief Operating Officer. Not Just a Fair Share, A Fair Shake. Setting the record straight.

E N D
Not Just a Fair Share, A Fair Shake andA Fair Chance at SustainabilitySpring 2011 Presented by: Gary D. Bixhorn SCSSA Legislative Chairperson Eastern Suffolk BOCES, Chief Operating Officer
Not Just a Fair Share, A Fair Shake • Setting the record straight. • The Executive Budget - Do we get a fair share? • The Tax Cap - Do we get a fair shake? • The sustainability of Long Island’s education system – Do we have a fair chance?
Setting the Record Straight:New York State Education National Ranking Education Week: Quality Counts Report NYS Earns a “B” (second only to Maryland)
Setting the Record Straight:Long Island Outcomes - All this and 57 of 300 Intel Semifinalists
Setting the Record Straight:Long Island Outcomes - All this and 57 of 300 Intel Semifinalists
Setting the Record Straight: Long Island School Performance & Resource Gap Percentage of Students in Long Island’s Least Wealthy and Wealthiest School Districts Passing the Elementary/Middle Level Assessments and Regents Exams
Setting the Record Straight: Long Island School Performance & Resource Gap Percentage of Students in Long Island’s Least Wealthy and Wealthiest School Districts Passing the Elementary/Middle Level Assessments and Regents Exams
Setting the Record Straight: Community Support for Long Island Budgets • 2010-11: 100.0% (124 of 124) passed - 114 on first vote • 2009-10: 98.0% (122 of 124) passed - 122 on first vote • 2008-09: 97.5% (121 of 124) passed - 116 on first vote • 2007-08: 99.0% (123 of 124) passed - 117 on first vote • 2006-07: 97.0% (120 of 124) passed - 105 on first vote Source: N-SSBA
Setting the Record Straight: School Funding • The foundation formula shortchanges Long Island - recognized as a problem since the day it was introduced. • Wealth measures tend to overstate Long Island’s wealth. • CFE settlement has forced reduction of regional share - exploded state deficit. • Regional cost differences are not truly recognized. • Reduced reliance on expense-driven formulas hurts high cost regions.
Setting the Record Straight: School Funding/Expenditures Long Island School Expenditures: Long Island SchoolExpenditures: After adjusting for inflation*, the average annual percentage increase is 1.67%. *Average annual change over 24-year period adjusted for NY-Northern NJ-LI CPI. Formula for calculating inflation provided by the US Bureau of Labor Statistics.
Setting the Record Straight: School Funding/Aid State Aid to Long Island Schools: State Aid to Long Island Schools: After adjusting for inflation*, the average annual percentage decrease is 0.37%. *Average annual change over 24-year period adjusted for NY-Northern NJ-LI CPI. Formula for calculating inflation provided by the US Bureau of Labor Statistics.
Setting the Record Straight: School Funding • State aid as a share of expenses has dropped from 32.2% in 1988-89 to a projected 21.0% in 2011-12. • Property taxes have backfilled drop - hence current level of overdependence. • Taxpayers on Long Island pay 65% more of their gross household income in property taxes than New Yorkers in general (7.8% vs. 4.74%).
Setting the Record Straight: Superintendents’ Salaries • Average Suffolk superintendent salary: $209,900 • Average Suffolk superintendent total compensation: $253,300 • Superintendents’ salaries as a percent of tax levy: 0.2% • Average teacher salary (25 years exp., MA + 60 credits): $103,440 *Superintendent salary data from NYSED Chapter 474 Report
Setting the Record Straight: Cost Drivers & Mandates • Pension contributions are mandated. • Mandates are generally well intentioned -introduced in response to need. • Special education mandates tend to protect certain cost centers. Pressure focused on limited share of budget. • Mandate relief will not happen by consensus.
Setting the Record Straight: Consolidation/Shared Services/BOCES • Communities resistant to consolidation need a “win-win”. • “Shared services” accepted business practice - can do more. • BOCES Advocacy issues • Retain the BOCES Aid Formula • Public vs. Private Excess Cost Aid Formula • Workers Compensation Reserve Fund • Reimburse MTA Tax • Expand BOCES Role
The Executive Budget: Do We Get a Fair Share? Regional Impact • Long Island schools enroll approximately 17% of the students in the state but receive only 12% ($2.292 billion) of all school aid ($19.129 billion). • Long Island schools absorbed a disproportionately large share (14.5% or $223 million) of the statewide school aid reduction ($1.537 billion). • Long Island school aid was reduced by 8.9%, which is 22.6% greater than the 7.2% cut to the rest of the state. • Long Island school aid per pupil is reduced to $4,246, which is 31.7% lower than the rest of the state ($6,216).
The Executive Budget: Do We Get a Fair Share? Formula Issues • The school aid formulas remain broken. There are 29 low wealth (CWR<1.0) school districts on Long Island enrolling 35% of the students (158,927). The median aid cut among these districts is 8.8% ($3 million). Of the 29 districts, 12 will experience a double-digit aid decrease. • Foundation Aid, which comprises 78% of all state aid (before GEA), is $3,329 per pupil on Long Island. This is 31.2% lower than the rest of the state ($4,835). • The GEA cuts into Long Island school aid far more deeply (8.9%) than in New York City (6.5%) and the rest of the state (7.2%).
The Executive Budget: Do We Get a Fair Share? Tax Levy Impact • The Island-wide loss in aid will drive a 3.0% increase in the tax levy. • On a county-by-county basis, the loss of aid will drive a 3.9% tax levy increase in Suffolk, and a 2.2% tax levy in Nassau.
The Executive Budget: Do We Get a Fair Share? • “The Devil is in the Details” – analysis ongoing • 2012-13 Loss of BOCES Aid – $1.9 million/ 5.5% • BOCES Management Services non-aidable – as much as $9.8 million/ 28% • What about fund balance? • What about cost shifts? • 30-day amendments
The Tax Cap: Do We Get a Fair Shake? Tax Levy Basics The school property tax levy represents the amount of funding a school district needs to raise through property taxes to balance its budget. The Property Tax Levy is calculated as follows: Projected School Spending ( - ) minus state aid ( - ) minus other revenues ( - ) minus prior year’s fund balance = Property Tax Levy On Long Island, property taxes comprise nearly 70% of school funding.
Overdependence on property taxes is real. Governor Cuomo’s top priority is the introduction of a Property Tax Cap. It was passed in the Senate on January 31, 2011 (S.2706). The Paterson proposed Property Tax Cap was the lesser of 4%, or 120% of the CPI increase. Caps the levy, not the tax rate. The Tax Cap: Do We Get a Fair Shake?
The Tax Cap: Do We Get a Fair Shake? The Proposed Cap (NYSSBA Analysis) • Community votes up or down on the tax levy - not budget. • Commissioner of Education determines annual cap. • Levy within cap requires approval by majority vote. • Levy above cap requires approval by supermajority (60%). • Failure of two consecutive levy proposals results in zero growth levy. • No contingency budgets.
The Tax Cap: Do We Get a Fair Shake? What would make it more fair? SCSSA Tax Cap Design Principles • Any cap should be sensitive to “NYS Maintenance of Effort.” • Any cap should be sensitive to “Local Control.” • Any cap should be sensitive to “Cost Increases Beyond District Control.” • Any cap should be sensitive to “Community Input.” • Any cap should be “Introduced in Conjunction with Mandate Relief.”
The Tax Cap: Do We Get a Fair Shake? How will this resolve itself? • Where will the Assembly go? • Will the Senate take another look? • What will the Governor accept?
A Fair Chance at Sustainability • The Facts / The Challenges • Aging population • Growing diversity • Retention of next generation • Regional income vs. state average • Sustainability Strategies
A Fair Chance at Sustainability Sustainability Strategies- LIRPC Education Work Group • Fix low-performing schools • Advocate for Mandate Relief • Expanded use of technology for student course offerings • Restructure high school experience • Incentivize consolidation • Rein in pension costs
A Fair Chance at Sustainability Sustainability Strategies- LIRPC Education Work Group (cont’d) • Rein in Health Insurance Costs • Restructure the school funding system • Explore regionalized employment structures • Use schools as community centers • Advocate for workforce housing • Monitor progress
What We Must Do Immediately • Speak with one voice on the biggest issues – “Long Island should be respected.” • Respect different perspectives on “hot issues.” • Verify your district data with regard to the Executive Budget proposal and tax cap. • Identify the impact/choose a likely scenario(s). • Tell Your Story – Be Direct & Truthful • to Legislators • to Internal Stakeholders • to External Stakeholders • Other local issues.
Questions? Gary D. Bixhorn SCSSA Legislative Chairperson Eastern Suffolk BOCES, Chief Operating Officer (631) 687-3001 Andrea M. Grooms Eastern Suffolk BOCES Director, Communications, Research & Recruitment (631) 687-3265/ agrooms@esboces.org
Eastern Suffolk BOCES Board and Administration President – Pamela Betheil Vice President– Lisa Israel Member and Clerk – Fred Langstaff Members Walter Wm. Denzler, Jr. William Hsiang William K. Miller Stephen Dewey, Ph.D. Susan Lipman Jeffrey Smith Chris Garvey Joseph LoSchiavo Sandra Townsend Katherine J. Heinlein Anne Mackesey John Wyche Chief Operating Officer Gary D. Bixhorn Deputy Superintendent Julie Davis Lutz, Ph.D. – Educational Services Associate Superintendent Barbara M. Salatto – Management Services Assistant Superintendent R. Terri McSweeney, Ed.D. – Human Resources Director Andrea Grooms – Communications, Research and Recruitment Eastern Suffolk BOCES does not discriminate against any employee, student, applicant for employment, or candidate for enrollment on the basis of gender, race, color, religion or creed, age, national origin, marital status, disability, or any other classification protected by law. For further information or concerns regarding this statement, please contact the Eastern Suffolk BOCES Department of Human Resources at (631) 687‑3029.