Advanced Volatility Forecasting Models for Global Investment Management
This presentation outlines a comprehensive approach to establishing variance forecasting models vital for risk management and investment decision-making. We explore different forecasting methodologies, including Simple GARCH and its extensions, using a robust dataset spanning ten years. The results demonstrate that country-specific models yield the best predictive power, with significant insights into exchange rates and interest rates for various markets. Our findings emphasize the absence of a universal model in forecasting volatility, underscoring the need for tailored approaches based on local and global financial instruments.


Advanced Volatility Forecasting Models for Global Investment Management
E N D
Presentation Transcript
VOLATILITY FORECASTING Steven Poher Ramzi Rached Ricardo Uribe Dongting Zheng Global Investment Management
AGENDA • Objective • Background Information • Forecasting Models • Data set • Methodology • Results • Conclusion
OBJECTIVE • Objective • To establish a variance forecasting model • Why? • Important for risk managers (VaR) • Used to price options • Volatility + Return = investment decision
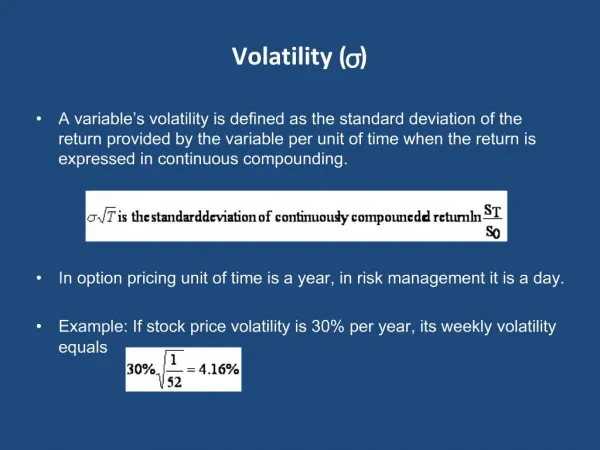
BACKGROUND INFORMATION • Realized / observed volatility is measured by squared returns • Volatility displays a positive correlation with its own past • Simple Model • PB : Equal weights on the past m observations
FORECASTING MODELS • More flexible model SimpleGARCH or GARCH (1,1) • Extended to Local and Global Instruments • Models to be tested for this project • GARCH (1,1) • GARCH (1,1) + Local • GARCH (1,1) + Global • GARCH (1,1) + Local + Global
DATA SET • Source DataStream • Period 3/27/1998 - 3/28/2008 (10 years) • Granularity 1 day
DATA SET • Local Instruments • Change in Exchange Rates • EUR / USD / JPY / GBP • Change in short-term interest rates • T-Bill (US) / BTAN (FR) • Global Instruments • Change in Short-term Eurodollar rate • Change in the Term Structure spread
METHODOLOGY • Using EXCEL, test our 4 models for each of our 5 markets • Use Maximum Likelihood Estimation (MLE) to estimate / / / EXCEL Solver • Test the models using a regression of Squared Returns vs. Forecasted Variance • Discuss the statistical significance of the regression / Select the best model for a given country
RESULTS Best models for each country
RESULTS • Best model for GermanMarket • R2 of 15.56% • Final equation • Simple GARCH + • % Change in €/£ Exchange (L) + • % Change in Term Structure Spread (G)
CONCLUSION • No universal model • Different countries = different models • Good proxy for DE / Bad for JP • GARCH could also be extended • Leverage effects • Day-of-week effects • Jumps • Economic intuition & reality check
QUESTIONS? THANK YOU