5.3. Noise characteristics
460 likes | 738 Vues
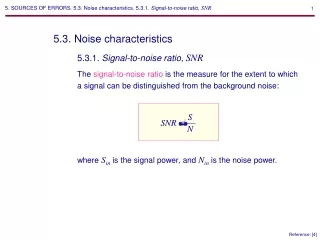
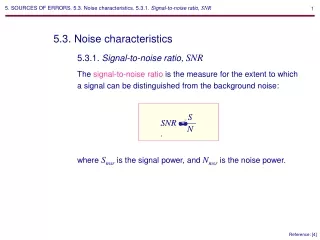
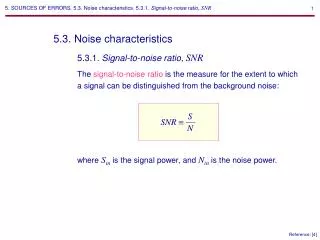
5. SOURCES OF ERRORS. 5.3. Noise characteristics. 5.3.1. Signal-to- noise ratio, SNR. 5.3. Noise characteristics. 5.3.1. Signal-to- noise ratio, SNR. The signal-to- noise ratio is the measure for the extent to which a signal can be distinguished from the background noise:. S N. SNR .

5.3. Noise characteristics
E N D
Presentation Transcript
5. SOURCES OF ERRORS. 5.3. Noise characteristics. 5.3.1. Signal-to-noise ratio,SNR 5.3. Noise characteristics 5.3.1. Signal-to-noise ratio,SNR The signal-to-noise ratio is the measure for the extent to which a signal can be distinguished from the background noise: S N SNR where Sin is the signal power, and Nin is the noise power. Reference: [4] References: [1] and [2]
5. SOURCES OF ERRORS. 5.3. Noise characteristics. 5.3.1. Signal-to-noise ratio,SNR A. Signal-to-noise ratio at the input of the system,SNRin It is usually assumed that the signal power, Sin, and the noise power, Nin, are dissipated in the noiseless input impedance of the measurement system. Measurement object Measurement system ZS=RS + jXS Noiseless SNRin vS Zin=Rin + jXin RL Sin Nin SNRin References: [1] and [2]
VS 2 4kTRS B VS 2 Vn 2 3) SNRin= = . Note that SNRin is not a function of Zin. 5. SOURCES OF ERRORS. 5.3. Noise characteristics. 5.3.1. Signal-to-noise ratio,SNR Example: Calculation of SNRin Measurement object Measurement system ZS=RS + jXS Noiseless SNRin vS Zin=Rin + jXin RL VS 2 Zin (ZS+ Zin)2 Vn 2 Zin (ZS+ Zin)2 1) Sin= , 2) Nin= ,
5. SOURCES OF ERRORS. 5.3. Noise characteristics. 5.3.1. Signal-to-noise ratio,SNR B. Signal-to-noise ratio at the output of the system,SNRo 1) The measurement system is noiseless. Measurement object Measurement system ZS=RS + jXS SNRin Noiseless SNRo src vS Power gain,Ap RL So No src Sin Ap NinAp Sin Nin SNRo src = = SNRo src= SNRin References: [1] and [2]
Sin Ap (Nin+Nin msr)Ap Sin Nin = SNRo SNRin 5. SOURCES OF ERRORS. 5.3. Noise characteristics. 5.3.1. Signal-to-noise ratio,SNR 2) The measurement system is noisy. Measurement object Measurement system ZS=RS + jXS SNRin Noisy SNRo vS Power gain,Ap RL So No SNRo References: [1] and [2]
5. SOURCES OF ERRORS. 5.3. Noise characteristics. 5.3.2. Noise factor, F, and noise figure,NF 5.3.2. Noise factor, F, and noise figure,NF Noise factor is used to evaluate the signal-to-noise degradation caused by the measurement system (H. T. Friis, 1944). Measurement object Measurement system ZS=RS + jXS SNRin Noisy SNRo vS Power gain,Ap RL SNRin SNRo F
SNRo src SNRo = No src + No msr No src So/No src So/No No msr No src No No src = 1 + _____ = __________ 1 = _______ = _____ 5. SOURCES OF ERRORS. 5.3. Noise characteristics. 5.3.2. Noise factor, F, and noise figure,NF The signal-to-noise degradation is due to the additional noise, No msr , which the measurement system contributes to the load. Measurement object Measurement system ZS=RS + jXS SNRin Noisy SNRo vS Power gain,Ap RL SNRin SNRo F
5. SOURCES OF ERRORS. 5.3. Noise characteristics. 5.3.2. Noise factor, F, and noise figure,NF Example: Calculation of noise factor Here and below, we assume that the reactance in the source output impedance is compensated by the properly chosen input impedance of the measurement system (noise tuning). Measurement object Measurement system RS vin vo enS GV Voltage gain,AV RL No No src Vno2/RL 4kTRS B(GVAV)2 /RL F = Vno2 4kTRS B(GVAV)2 =
Vno2 4kTRS B(GAV)2 5. SOURCES OF ERRORS. 5.3. Noise characteristics. 5.3.2. Noise factor, F, and noise figure,NF Conclusions: F= The following three characteristics of noise factor can be seen by examining the obtained equation: 1. It is independent of the load resistance RL, 2. It does depend on the source resistance RS, 3. If the measurement system were completely noiseless, the noise factor would equal one. Reference: [2]
Vno2 4kTRS B(GAV)2 5. SOURCES OF ERRORS. 5.3. Noise characteristics. 5.3.2. Noise factor, F, and noise figure,NF C. Noise figure Noise factor expressed in decibels is called noise figure(NF): NF 10 log F Due to the bandwidth term in the denominator there are two ways to specify the noise factor: (1) a spot noise, measured at specified frequency over a 1-Hz bandwidth, or (2) an integrated, or average noise measured over a specified bandwidth. F= Reference: [2]
5. SOURCES OF ERRORS. 5.3. Noise characteristics. 5.3.2. Noise factor, F, and noise figure,NF E. Measurement of noise factor We will consider the following methods for the measurement of noise factor: (1) the single-frequency method, and (2) the white noise method. 1) Single-frequency method. According to this method, a sinusoidal test signal vS is increased until the output power doubles. Under this condition the following equation is satisfied: Measurement object Measurement system RS vin vo vS Gv Voltage gain,Av RL Reference: [2]
VS=0 VS=0 VS=0 VS=0 2)Vno2=(VSGVAV)2 (VSGVAV)2 4kTRS B(GVAV)2 = 5. SOURCES OF ERRORS. 5.3. Noise characteristics. 5.3.2. Noise factor, F, and noise figure,NF Measurement object Measurement system RS vin vo vS GV Voltage gain,AV RL 1)(VSGVAV)2+ Vno2=2Vno2 Vno2 VS2 4kTRS B No src = 3)F= Reference: [2]
5. SOURCES OF ERRORS. 5.3. Noise characteristics. 5.3.2. Noise factor, F, and noise figure,NF VS2 4kTRS B = F The disadvantage of the single-frequency method is that the noise bandwidth of the measurement system must be known. A better method of measuring noise factor is to use a white noise source. 2) White noise method. This method is similar to the previous one. The only difference is that the sinusoidal signal generator is now replaced with a white noise source: Reference: [2]
in=0 in=0 in=0 in=0 2)Vno2=(in RSGRAV)2 B Vno2 (in RSGRAV)2B 4kTRS B(GRAV)2 No src = 3)F= 5. SOURCES OF ERRORS. 5.3. Noise characteristics. 5.3.2. Noise factor, F, and noise figure,NF Measurement object Measurement system vin vo RS in (f) GR Voltage gain,Av RL 1)(in RSGRAV)2 B+ Vno2=2Vno2 in2RS 4k T =
5. SOURCES OF ERRORS. 5.3. Noise characteristics. 5.3.2. Noise factor, F, and noise figure,NF in2RS 4k T = F The noise factor is now a function of only the test noise signal, the value of the source resistance, and temperature. All of these quantities are easily measured. Neither the gain nor the noise bandwidth of the measurement system need be known. The standard reference temperature is T0= 290 K for thatkT0= 4.0010-21. (H. T. Friis: NF, Pa, and T0.)
5. SOURCES OF ERRORS. 5.3. Noise characteristics. 5.3.3. Vn- Innoise model 5.3.3. Vn- Innoise model The actual network can be modeled as a noise-free network with two noise generators, en and in, connected to its input (Rothe and Dahlke, 1956): Measurement object Measurement system RS en vo Noiseless vS Rin AV RL in In a general case, the en and in noise generators are correlated. Reference: [2]
5. SOURCES OF ERRORS. 5.3. Noise characteristics. 5.3.3. Vn- Innoise model Measurement object Measurement system RS en vo Noiseless vS Rin AV RL in The en source represents the network noise that exists when RS equals zero, and the in source represents the additional noise that occurs when RS does not equal zero, The use of these two noise generators plus a complex correlation coefficient completely characterizes the noise performance of a linear network. Reference: [2]
5. SOURCES OF ERRORS. 5.3. Noise characteristics. 5.3.3. Vn- Innoise model Example: Input voltage and current noise spectra (ultralow noise, high speed, BiFET op-amp AD745) en in Reference: www.analog.com
5. SOURCES OF ERRORS. 5.3. Noise characteristics. 5.3.3. Vn- Innoise model A.Total input noise as a function of the source impedance Measurement object Measurement system RS en vo Noiseless vS Rin AV RL in The total equivalent noise voltage reflected to the source location can easily be found if we apply the following modifications to the input circuit:
5. SOURCES OF ERRORS. 5.3. Noise characteristics. 5.3.3. Vn- Innoise model Measurement object Measurement system RS en vo Noiseless vs Rin AV RL in Measurement object Measurement system RS en vo Noiseless vS AV RL in Rs en at S = 4kTRS +en 2 +2rVn In +(in RS)2
5. SOURCES OF ERRORS. 5.3. Noise characteristics. 5.3.3. Vn- Innoise model We now can connect an equivalent noise generator in series with the input signal source to model the total input voltage of the whole system. We assume that the correlation coefficient in the previous equation r = 0. (For the case r 0, it is often simpler to analyze the original circuit with its internal noise sources.) Measurement object Measurement system RS en at S vo vS Voltage gain,AV RL en at S = 4kTRS + en 2 + (in RS)2 Reference: [7]
5. SOURCES OF ERRORS. 5.3. Noise characteristics. 5.3.3. Vn- Innoise model B.Measurement of en and in Measurement system en vn o Noiseless en = (Vn o /B) /AV AV RL in Measurement system 1) en o >> (4kTRt + en2)0.5 2) in Rt = (Vn o /B) /AV 3) in = [(Vn o /B) /AV ]/Rt en vn o Noiseless AV RL Rt in
+Dx Matching Influence 5. SOURCES OF ERRORS. 5.4. Noise matching: maximization of SNR 5.4. Noise matching: maximizing SNR The purpose of noise matching is to let the measurement system add as little noise as possible to the measurand. x Measurement Object Measurement System
5. SOURCES OF ERRORS. 5.4. Noise matching: maximization of SNR Let us first find the noise factor F and the signal-to-noise ratio SNRo of the measurement system as a function of the source resistance: F=f(RS) and SNRo=f(RS). No No src Nat S NR 4kTRS + en2 + (in RS)2 4kTRS = f(RS ) F = ____ = ____ = __________________ S VS2 4kTRS+en2 + (in RS)2 VS2 Nat S = _________________ = f(RS ) SNRo = SNRat S____ where, Nat S and SNRat S are the noise power and the signal-to-noise ratio at the source location. We then will try and maximize the SNRo at the output of the measurement system by matching the source resistance.
100 RSmaxSNR 20 10 vS = en·1 Hz0.5 10 0 -10 1 RS min F -20 en= in Rn -30 0.1 en in F 0.5, dB 100 101 102 103 104 RS opt= SNR0.5, dB RSopt is called the optimum source resistance (also noise resistance). 100 101 102 103 104 5. SOURCES OF ERRORS. 5.4. Noise matching: maximization of SNR. 5.4.1. Optimum source resistance 5.4.1. Optimum source resistance en = 2 nV/Hz0.5, in = 20 pA /Hz0.5 4kTRS + en2 + (in RS)2 4kTRS F = __________________ in RS VS2 4kTRS+en2 + (in RS)2 en SNR = _________________ en at S, nV/Hz0.5 Source noise Measurement system noise 4kTRS RS , W
20 10 0 -10 -20 -30 F 0.5, dB SNR0.5, dB 100 101 102 103 104 5. SOURCES OF ERRORS. 5.4. Noise matching: maximization of SNR. 5.4.1. Optimum source resistance 4kTRS + en2 + (in RS)2 4kTRS F = __________________ Vs2 4kTRS+en2 + (in RS)2 SNR = _________________ RS , W It is important to note that the source resistance that maximizes SNR is RS max SNR = 0, whereas the source resistance that minimizes F is RS min F = RSopt. We can conclude therefore, that for a given RS, SNRcannot be increased by connecting a resistor to RS.
20 10 0 -10 -20 -30 F 0.5, dB 4kTRS + en2 + (in RS)2 4kTRS F = __________________ SNR0.5, dB VS2 4kTRS+en2 + (in RS)2 SNR = _________________ 100 101 102 103 104 5. SOURCES OF ERRORS. 5.4. Noise matching: maximization of SNR. 5.4.1. Optimum source resistance Adding a series resistor, R,increases the total source resistance up to RS opt = RS + R and (!) decreases SNR. Measurement object RS vS RS<RS opt RS , W
20 10 0 -10 RS +R =RS opt -20 -30 F 0.5, dB 4kTRS opt+ en2 + (in RS opt)2 4kTRS opt 4kTRS + en2 + (in RS)2 4kTRS F = __________________ F = ______________________ SNR0.5, dB VS2 4kTRS+en2 + (in RS)2 VS2 4kTRS+en2 + (in RS)2 VS2 4kTRS+en2 + (in RS)2 SNR= ____________________ SNR = _________________ SNR = _________________ 100 101 102 103 104 5. SOURCES OF ERRORS. 5.4. Noise matching: maximization of SNR. 5.4.1. Optimum source resistance Adding a series resistor, R,increases the total source resistance up to RS opt = RS + R and (!) decreases SNR. Measurement object RS + R vS RS , W
20 10 0 -10 -20 -30 F 0.5, dB 4kTRS + en2 + (in RS)2 4kTRS F = __________________ SNR0.5, dB SNR0.5, dB VS2 4kTRS+en2 + (in RS)2 SNR = _________________ 100 101 102 103 104 RS , W 5. SOURCES OF ERRORS. 5.4. Noise matching: maximization of SNR. 5.4.1. Optimum source resistance Adding a parallel resistor, R,decreases by the same factor both the input signal and the source resistance seen by the measurement network, and therefore (!) decreases SNR. Measurement object RS vS RS>RS opt
20 20 10 10 0 0 RS /[(RS +R)/R]=RS opt -10 -10 VS/[(RS +R)/R]=VS -20 -20 -30 -30 F 0.5, dB F 0.5, dB 4kTRS + en2 + (in RS)2 4kTRS F = __________________ SNR0.5, dB SNR0.5, dB SNR0.5, dB VS2 4kTRS+en2 + (in RS)2 SNR = _________________ 100 100 101 101 102 102 103 103 104 104 RS , W RS , W 5. SOURCES OF ERRORS. 5.4. Noise matching: maximization of SNR. 5.4.1. Optimum source resistance Adding a parallel resistor, R,decreases by the same factor both the input signal and the source resistance seen by the measurement network, and therefore (!) decreases SNR. Measurement object RS vS R 4kTRS opt+ en2 + (in RS opt)2 4kTRS opt F = ______________________ VS 2 4kTRS+en2 + (in RS )2 VS2 4kTRS+en2 + (in RS)2 SNR= _____________________ SNR = _________________
5. SOURCES OF ERRORS. 5.4. Noise matching: maximization of SNR. 5.4.1. Optimum source resistance Conclusions. The noise factor can be very misleading: the minimization of F does not necessarily leads to the maximization of the SNR. This is referred to as the noise factor fallacy (erroneous belief).
5. SOURCES OF ERRORS. 5.4. Low-noise design: noise matching. 5.4.2. Methods for the increasing of SNR 5.4.2. Methods for the increasing of SNR Methods for the increasing of SNR are based on the following relationship: 1 F SNRo= SNRin The strategy is simple: to increase SNRo, keep SNRin constant while decreasing the noise figure: 1 F SNRo= SNRin The SNR at the output will increase because the relative noise power contributed by the measurement system will decrease.
k 5. SOURCES OF ERRORS. 5.4. Low-noise design: noise matching. 5.4.2. Methods for the increasing of SNR A. Noise reduction with parallel input devices This method is commonly used in low-noise OpAmps: to increase the SNR, several active devices are connected in-parallel: Measurement system en io sc vin gm vin Rin ro in en gm vin Rin ro in Reference: [7]
5. SOURCES OF ERRORS. 5.4. Low-noise design: noise matching. 5.4.2. Methods for the increasing of SNR Home exercise: Prove that the following network is equivalent to the previous one. Equivalent measurement system io sc en/k 0.5 vin kgm vin Rin k ro in k 0.5 Reference: [7]
5. SOURCES OF ERRORS. 5.4. Low-noise design: noise matching. 5.4.2. Methods for the increasing of SNR Thanks to parallel connection of input devices, it is possible to decrease the ratio, (en /in )p=(en /in )single/k, with no change in vS and RS, and hence in the SNRin. Measurement object Equivalent measurement system io sc en/k 0.5 RS vin kgm vin vS Rin k ro in k 0.5 en /in RS en k in k = SNRo = SNRomaxand F = Fminat RS = Note that SNRo cannot be improved if the RS is too large. Reference: [7]
5. SOURCES OF ERRORS. 5.4. Low-noise design: noise matching. 5.4.2. Methods for the increasing of SNR Home exercise: Prove that SNRo p = kSNRosingle at F min Reference: [7] Reference: [7]
SNRin SNRo F 1 F SNRo= SNRin . 5. SOURCES OF ERRORS. 5.4. Low-noise design: noise matching. 5.4.2. Methods for the increasing of SNR B. Noise reduction with an input transformer Measurement object Measurement system en RS vin vo 1:n vS AV RL in n2RS nvS (nVS )2 4kTn2Rin = const, SNRin=
1 F SNRo= SNRin 100 20 10 vS = en·1 Hz0.5 10 0 -10 1 RS forminimum F -20 F Fmin -30 SNRo (1:n) = SNRo 0.1 F 0.5 Fmin0.5 F 0.5, dB 100 101 102 103 104 SNRo(1: n)0.5 SNRo (1:n) = n2SNRo Fmin SNRo 0.5 SNRo (1: n)0.5 RS opt RS SNRo F min0.5 n2 = 100 101 102 103 104 5. SOURCES OF ERRORS. 5.4. Low-noise design: noise matching. 5.4.2. Methods for the increasing of SNR Example: Noise reduction with an ideal input transformer B = 1 Hz, en = 2 nV/Hz0.5, in = 20 pA /Hz0.5 RS 1:n vS in Rs en en at S, nV/Hz0.5 RS n2 vS n Source noise 4kTRsB Measurement system noise SNR0.5, dB RS, W
5. SOURCES OF ERRORS. 5.4. Low-noise design: noise matching. 5.4.2. Methods for the increasing of SNR Home exercise: Prove that SNRo (1:n) = n2SNRo Fmin
5. SOURCES OF ERRORS. 5.4. Low-noise design: noise matching. 5.4.2. Methods for the increasing of SNR Example: Noise reduction with a non-ideal input transformer RS R1 R2 1:n vS (RS + R1) n2 + R2 vS n
5. SOURCES OF ERRORS. 5.4. Low-noise design: noise matching. 5.4.3. SNR of cascaded noisy amplifiers 5.4.3. SNR of cascaded noisy amplifiers Our aim in this section is to maximize the SNR of a three-stage amplifier. enS1 enS2 enS3 RS vO AV 1 AV 2 AV 3 vS Reference: [4]
VS 2 /B enS12+ enS22/AV12 + enS32/AV12AV22 3) SNRo Conclusion: keep AV1>>1 to neglect the noise contribution of the second and third stages. 5. SOURCES OF ERRORS. 5.4. Low-noise design: noise matching. 5.4.3. SNR of cascaded noisy amplifiers enS1 enS2 enS3 RS vO AV 1 AV 2 AV 3 vS VS 2 Vno2/(AV12 AV22 AV32) 1) SNRo= SNRat S 2) Vno 2= [enS12AV12 AV22 AV32 + enS22 AV22 AV32 + enS32 AV32 ]B Reference: [4]
Next lecture Next lecture: