Download
1 / 62
620 likes | 792 Vues
Global warming represents a critical challenge for our planet, driven primarily by human activities, particularly fossil fuel emissions. The Earth's temperature and carbon dioxide levels are rising, indicating a troubling fever for the planet. This warming disrupts climates worldwide, causes extreme weather events, and threatens ecosystems. Mitigation strategies, such as reducing emissions, and adaptation approaches are essential for addressing the consequences. As observed, the atmosphere acts as a global commons, necessitating coordinated international efforts to combat this pressing issue.

E N D
Global Warming:Coming Ready or Not! Help! Kevin E Trenberth NCAR NCAR Earth System Laboratory NCAR is sponsored by NSF
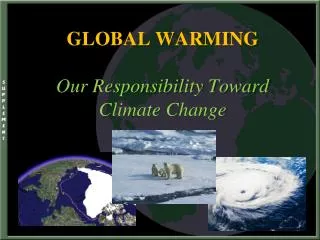
Climate The atmosphere is a “global commons.” Air over one place is typically half way round the world a week later, as shown by manned balloon flights. The atmosphere is a dumping ground for all nations for pollution of all sorts. Some lasts a long time and is shared with all. One consequence is global warming!
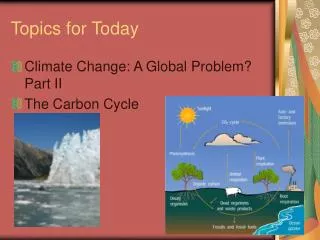
Running a fever:Seeing the doctor • Symptoms: the planet’s temperature and carbon dioxide are increasing • Diagnosis: human activities are causal • Prognosis: the outlook is for more warming at rates that can be disruptive and will cause strife • Treatment: mitigation (reduce emissions) and adaptation (planning for consequences)
What Is Causing the Warming? Emissions of carbon dioxide pollution Courtesy Scott Mandia
World Primary Energy Supply: 1800 – 2008 Fossil fuels Hydro + :means hydropower plus other renewables other than biomass. Sources: Grubler (2008) - Energy Transitions, BP (2009) – Statistical Review of World Energy, EIA (2009) – International Energy Annual
Changing atmospheric composition: CO2 Mauna Loa, Hawaii ppm 390 380 370 360 350 340 330 320 310 Rate increasing 1960 1970 1980 1990 . 2000 2010 Data from Climate Monitoring and Diagnostics Lab., NOAA. Data prior to 1974 from C. Keeling, Scripps Inst. Oceanogr.
2007 emissions: Population matters China biggest emitter • 14% more than US • Per capita Pop. U.S.: 19.4 0.31 Russia: 11.8 0.14 E. U.: 8.6 0.50 China: 5.1 1.33 India: 1.8 1.14 tons Billions Netherlands Environmental Assessment Agency 2008
Population explosion Billions: time 0.2 1 0.5 1650 1: 1804 2: 1927 103 3: 1960 33 4: 1974 14 5: 1987 13 6: 1999 12 7: 2011 12
The Natural Greenhouse Effect: clear sky CH4 N20 6% O3 8% Water Vapor 60% Carbon Dioxide 26% Clouds also have a greenhouse effect Kiehl and Trenberth 1997
The incoming energy from the sun • amounts to 175 PetaWatts • =175,000,000 billion Watts. • About 122 PW is absorbed. • The biggest power plants in existence • are 1000 MegaWatts and we normally think of units of • 1 KiloWatt (= 1 bar heater), or a 100 W light bulb. • So the energy from the sun is 122 million of these power stations. It shows: • Direct human influences are tiny vs nature. • The main way human activities can affect climate is through interference with the natural flows of energy such as by changing the composition of the atmosphere
Solar irradiance The drop of 1.2 W m-2 since 2001 is equivalent to -0.2 Wm-2 in radiative forcing
Global Warming is UnequivocalIPCC: approved 113 govts Since 1970, rise in: Decrease in: • Global surface temperatures NH Snow extent • Tropospheric temperatures Arctic sea ice • Global SSTs, ocean Ts Glaciers • Global sea level Cold temperatures • Water vapor • Rainfall intensity • Precipitation extratropics • Hurricane intensity • Drought • Extreme high temperatures • Heat waves • Ocean acidity
The seas are warming up, turning sour, and losing breath Nocolas Gruber (Phil Trans Roy Soc 2011) • Higher SSTs, higher ocean Temperatures, • Sea ice melt • Increased stratification • Global sea level rise • Acidification (increased dissolved CO2) • Oxygen loss (de0xygenation: nutrients from land) • Corals in hot water: bleaching • Phytoplankton on the wane • Dead zones increasing Porites coral Kirabati, May 2010 Phytoplankton bloom off Norway, MODIS, NASA 24 Jul 2004
Global temperature and carbon dioxide: anomalies through 2011 Base period 1900-99; data from NOAA
Controlling Heat Human body: sweats Homes: Evaporative coolers (swamp coolers) Planet Earth: Evaporation (if moisture available) e.g., When sun comes out after showers, the first thing that happens is that the puddles dry up: before temperature increases.
Human impacts on climate related to water • Warming:more heat, higher temperatures • The atmosphere can hold more water vapor • 4% per °F = observed • Over wet areas (ocean) => more moisture • More heat more evaporation more precipitation • Longer dry spells, more drought (where not raining) • More intense rains/snows • More intense storms • More floods and droughts
Most precipitation comes from moisture convergence by weather systems Rain comes from moisture convergence by low level winds: More moisture means heavier rains
Declining Snow Pack in many mountain and continental areas contributes to drought • moreprecipitationfalls as rain rather than snow, especially in the fall and spring. • snow meltoccurs faster and sooner in the spring • earlier runoff and peak streamflow • snow packis therefore less • soil moistureis less as summer arrives • the risk of droughtincreases substantially in summer • Along with wild fire
Trends 1948-2004 in runoff by river basin Based on river discharge into ocean WET WET DRY WET Dai et al.2009
North Atlantic hurricanes have increased with SSTs Katrina August 2005 The 2005 season broke many records
North Atlantic hurricanes have increased with SSTs N. Atlantic hurricane record best after 1944 with aircraft surveillance. Global number and percentage of intense hurricanes is increasing Thru 2011 2010 (1944-2006) SST Marked increase after 1994
Isaac Aug 28, 2012 Courtesy NASA
Sea level is rising:from ocean expansion and melting glaciers 40 30 20 10 mm 0 -10 -20 -30 -40 Since 1992 Global sea level has risen 55 mm (2.2 inches) To 2003: 60% from expansion (ocean temperatures) 40% from melting glaciers/land ice. 2003-10: 1.5 mm/yr from melting land ice. 2010-11: big dip contribution from rain on land. AVISO: from TOPEX, Jason 1, Jason 2. Ann cy removed, IB, GIA applied
Evidence for reality of climate change Glaciers melting Muir Glacier, Alaska 1909 Toboggan Glacier Alaska 2000 1900 2003 Alpine glacier, Austria Increased Glacier retreat since the early 1990s
Snow cover and Arctic sea ice are decreasing Arctic sea ice area decreased by 40% in summer 2007: 22% (106 km2) lower than 2005 2012 lowest on record Late August 2012 NSIDC; NASA
Climate change and extreme weather events Changes in extremes matter most for society and human health With a warming climate: • More high temperatures, heat waves • Wild fires and other consequences • Fewer cold extremes. • More extremes in hydrological cycle: • Drought • Heavy rains, floods • Intense storms, hurricanes, tornadoes
The environment in which all storms form has changed owing to human activities.
JJA NH Frequency of summer temperature anomalies (how often they deviated from the historical normal of 1951-80) over the summer months in the northern hemisphere. Source: NASA/ Hansen et al. 2012 http://climatecrocks.com/2012/08/05/hansen-on-the-new-math-of-extreme-events/
U.S. daily temperature extremes 2010 2011 2012 2.3:1 2.7:1 9.0:1 The ratio of record daily highs (red) to record daily lows (blue) at about 1,800 weather stations in the 48 contiguous United States from Jan. 1950 to Sept. 2009. Meehl et al. GRL 2009. Update using NOAA data: Climatecommunication.org
Russia Aug 2010 >50,000 lives lost Record heat Wild fires India: Jul-Aug 2010 Pakistan: Jul-Aug 2010 Courtesy NASA
Australia Flooding Queensland Early Jan 2011
SSTs: JJA 2010 Record high: Aug 2010 Hurricanes 2nd most active Record high: May 2010 Pakistan floods July-Aug Record high: Dec 2010 S-O-N 2nd highest Queenslandfloods Dec-Jan Record high: Sep 2010 2nd highest Oct 2010 Colombia floods Aug-Dec Trenberth 2012, Cli Change
Mississippi River Tornadoes galore April 21, 2011 NASA May 1, 2011
Flooding on the Mississippi: There were multiple “1-in-500 year” or “1-in-100 year flood events within a few years of each other in parts of the Basin… 1993 Then again in 2008. And now: 2011 AP 2000; NYT 2011 Peter Gleick
Arizona on fire June 7-14, 2011 Biggest fire ever (also Mexico) Drought, heat, worst wild fire in Texas history! Bastrop State Park: 14,000 acres, Nearly 600 homes destroyed. 5 Sept 2011 JJA 2011:Hottest on record
Recent US climate extremes June in March March 2012
Colorado on Fire: June 2012 Flagstaff fire: above NCAR, circled. High Park fire 259 houses, 1 death Waldo Canyon fire 346 homes…
News Outlets Avoid Topic Of Climate Change In Wildfire Stories http://mediamatters.org/research/2012/07/03/study-media-avoid-climate-context-in-wildfire-c/186921
U.S. Temperatures Jan-Jul 2012 Hottest on record Aug 2011-Jul 2012 Hottest year on record NCDC, NOAA
Meanwhile: record flooding elsewhere: Southern Russia Early July 2012 172 dead 11 inches of rain Water rose 12 feet in mins Poor warnings Southern Japan 6-12 July 2012 Torrential rain (> 10”): flash floods, mudslides >32 dead or missing. 400,000 evacuated. Beijing 21-22 July 2012 $2B damage Worst rains in 61 years: (up to 18 inches) Kyushu NASA
Natural forcings do not account for observed 20th century warming after 1970 Meehl et al, 2004: J. Climate.
Projected temperature change CCSM Movie
Projected Frequency of Extreme Heat: 1-in-20 Year Events. By the end of this century, a once-every-20 year heat wave is projected to occur every other yearSource: U.S. GCRP
Projected Patterns of Precipitation Change 2090-2100 Rich get richer and poor get poorer: Combined effects of increased precipitation intensity and more dry days contribute to mean precipitation changes, increased evaporation also important for soil moisture. IPCC 2007
Future prospects To avoid disastrous climate, “the scientific view is that the increase in global temperature should be below 2°C”: about 3.6°F. To achieve that “deep cuts in global emissions are required” Copenhagen Accord, 2009. So far, temperatures have risen 0.8°C. But we are committed already to at least 0.6°C more owing to the slowly warming oceans and long lifetime of CO2. In fact 2°C is programming in many problems...