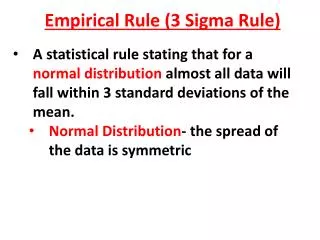
The Empirical Rule
The Empirical Rule. Note that the empirical APPLIES ONLY TO NORMAL DISTRIBUTIONS . The empirical Rule states that Approximately 68% of the data values fall within one standard deviation of the mean Approximately 95% of the data values fall within 2 standard deviations of the mean

The Empirical Rule
E N D
Presentation Transcript
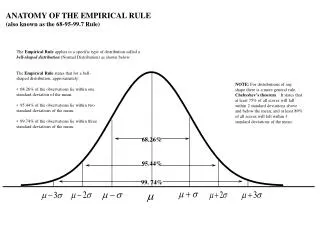
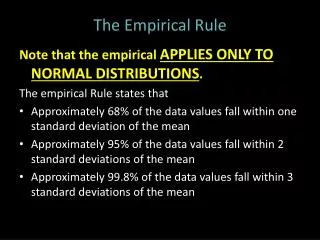
The Empirical Rule Note that the empirical APPLIES ONLY TO NORMAL DISTRIBUTIONS. The empirical Rule states that • Approximately 68% of the data values fall within one standard deviation of the mean • Approximately 95% of the data values fall within 2 standard deviations of the mean • Approximately 99.8% of the data values fall within 3 standard deviations of the mean
The Empirical Rule ~ 68% of the Observations Fall Within (±) 1 Standard Deviation Around the Mean 68% _ -1s X +1s
The Empirical Rule ~ 95% of the Observations Fall Within (±) 2 SD Around the Mean 95% _ -2s -1s X +1s +2s
The Empirical Rule ~ 99.8% of the Observations Fall Within (±) 3 SD Around the Mean 99.8% _ -3s-2s -1s X +1s +2s +3s
_ _ _ _ _ _ _ X - s X + 2s X + 3s X - 3s X - 2s X X + s
Assume you have a normal distribution of test scores with a mean of 82 and a standard deviation of 6. -What percent of the data scores were above a 76? -68% of the data fall between what two scores?
_ X = 82 s = 6 100 64 70 76 82 88 94 -6 -6 -6 +6 +6 +6
What percent of the data scores were above a 76? 100 64 70 76 82 88 94 Add up all of the percentages you shaded: 34 + 34 + 13.5 + 2.4 + 0.1 = 84%
68% of the data fall between what two scores? 100 64 70 76 82 88 94 The “boundaries” around 68% of the data are: 76, 88
A charity puts on a relay race to raise money. The times of the finishes are normally distributed with a mean of 53 minutes and a standard deviation of 9.5 minutes. -What percent of the data times were between 34 and 81.5 minutes? -95% of the data fall between what two times? -What percent of the data times were below 72 minutes?
_ X = 53 s = 9.5 24.5 34 43.5 53 62.5 72 81.5 -9.5 -9.5 -9.5 +9.5 +9.5 +9.5
What percent of the data times were between 34 and 81.5 minutes? 24.5 34 43.5 53 62.5 72 81.5 Add up all of the percentages you shaded: 13.5 + 34 + 34 + 13.5 + 2.4 = 97.4%
95% of the data fall between what two times? 24.5 34 43.5 53 62.5 72 81.5 The “boundaries” around 95% of the data are: 34, 72
What percent of the data times were below 72 minutes? 24.5 34 43.5 53 62.5 72 81.5 Add up all of the percentages you shaded: 0.1 + 2.4 + 13.5 + 34 + 34 + 13.5 = 97.5%