Tier 3
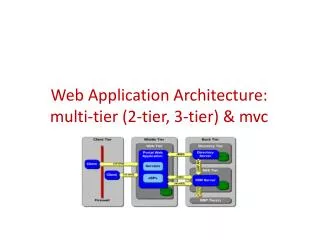
Tier 3. and Tier 3 monitoring. 17.05.2012. Ivan Kadochnikov LIT JINR. Overview. WLCG structure Tier3 T3mon concept Monitoring tools T3mon implementation. WLCG structure. Goals of WLCG Hierarchic approach Production and analysis Argument for Tier3. Goals of WLCG.

Tier 3
E N D
Presentation Transcript
Tier 3 and Tier 3 monitoring 17.05.2012 Ivan Kadochnikov LIT JINR
Overview • WLCG structure • Tier3 • T3mon concept • Monitoring tools • T3mon implementation
WLCG structure • Goals of WLCG • Hierarchic approach • Production and analysis • Argument for Tier3
Goals of WLCG • Turn detector signal into physics • Atlas for example: • 1 Pb/s => The trigger => 200 Mb/s • 15 petabytes of raw data per year • To do: • store • processes • analyze
Hierarchic approach • Tier 0 • the CERN computer centre • safe-keeping the first copy of raw data • first pass reconstruction • Tier 1 • 11 centers all around the world • safe-keeping shares of raw, reconstructed, reprocessed and simulated data • reprocessing • Tier 2 • about 140 sites • production and reconstruction of simulated events • analysis
Production and analysis • Data selection algorithms improve • Calibration data change • Re-processing several times a year of all data gathered since LHC start-up
Argument for Tier3 • Analysis on Tier2 is inconvenient • Institutions have local computing resources • Local access and resources dedicated to analysis improve user response time dramatically
Tier3 • What is Tier3? • Types of Tier3 • Compare and contrast: Tier2 • Current status • Need for monitoring
What is Tier 3 • non-pledged computing resources • institutional computing • no formal commitment to WLCG • for analysis • not really another level of the model
Types of Tier3 sites • Tier3 with Tier2 functionality • Collocated with Tier2 • National analysis facilities • Non-grid Tier3’s
Compare and contrast: Tier2 Tier3 Different jobs All VO users Strict requirements on the quality of service Pledged resources A set of mandatory grid services on site Processed data can go back in the grid VO central control Analysis only Local/regional users No QOS information gathered globally (yet!) Non-pledged resources Often no grid services, may be a full or partial set No data allowed back in the grid Local control
Current status • More than 300 Tier3 sites right now • A survey by Atlas in 2010 • Tier 3 come many different sizes • Storage methods vary • Different LRMSs used • Different ways to access WLCG • Many don’t have monitoring • Limited manpower
Need for monitoring • any system needs monitoring • some information is required on the global level • dataset popularity • usage statistics • grid services may not be present • existing grid monitoring systems can’t be used • Tier 3 sites have limited manpower • need an easy way to set up monitoring
T3mon concept • Users and requirements • What to monitor • Structure • Local monitoring • Global monitoring
Users and requirements • local administrators • detailed fabric monitoring • resources management systems (LRMS) • mass storage systems (MSS) • VO managers • general usage statistics and quality of service • global services • dataset popularity
What to monitor • local resources management systems • Proof • PBS • Condor • Oracle Grid Engine • mass storage systems (MSS): • XRootD • Lustre
Components • Local monitoring • detailed fabric monitoring • gather data used by the global system • present detailed data to local administrators • Global monitoring • aggregate metrics from local monitoring • give necessary information to central services • present data via Dashboard
Local monitoring system MSG Proof Condor Publishing agent Local DB XRootD PBS Ganglia OGE Lustre
Global monitoring system Dashboard Data management C C MSG Local monitoring system Local monitoring system Local monitoring system Local monitoring system P P P P
Tools • Ganglia • data flow • plug-in system • Dashboard • MSG • ActiveMQ
Ganglia • distributed monitoring system for clusters and Grids MSG Proof Condor Publishing agent Local DB XRootD PBS Ganglia OGE Lustre
Why Ganglia? • easy to set up fabric monitoring • popular choice among Tier 3 sites • extension modules for LRMS and MSS monitoring
Ganglia data flow head node web frontend rrdtool string metrics gmetad numeric metrics node node xml by request gmond gmond XDR via UDP gmond
Adding custom metrics custom monitoring daemon gmond module gmetric callback monitored subsystem monitored subsystem ganglia
Dashboard • “The Experiment Dashboard's main goal is to collect and expose to users relevant information about the services and applications running on the grid environment“ Other Applications Tier3 software Feeders Messaging system Web Application Collectors Data Access Layer (DAO)
MSG • WLCG Messaging System for Grids • “Aims to help the integration and consolidation of the various grid monitoring systems used in WLCG” • Based on ActiveMQ open-source message broker
T3Mon implementation • Project structure • Subsystem modules • Proof monitoring module • PBS monitoring module • Condor monitoring module • Lustre monitoring module • XRootD monitoring module • Testing infrastructure
Project structure • Python • SVN provided by CERN • RPM repository with a separate package for each monitoring module • Each module handles one software system to be monitored on Tier3 • One configuration file for all modules
Proof MSG Ganglia gmond Proof plug-in database Proof
PBS MSG Ganglia gmond PBS plug-in log files PBS
Condor Ganglia MSG gmond … Condor Condor plug-in condor_master condor_startd database condor_quill
Lustre Ganglia gmond Lustre plug-in Lustre /proc/fs/lustre
XRootD MSG xrddetmond xrootd.py Ganglia cmsd cmsd database xrootd gmond xrootd xrdsummond gmetric mpxstats summary_to_ganglia.py
Testing infrastructure • Goals • Document installing Ganglia on a cluster • Document configuring Tier3 subsystems for monitoring • Test modules in a minimal cluster environment • Clusters: • PBS: 3 nodes (1 head node, 2 worker nodes) • Proof: 3 nodes (1 hn, 2 wns) • Condor: 3 nodes (1 hn, 1 wn, 1 client) • OGE: 3 nodes (1 hn, 2 wn) • Lustre: 3 nodes (1 MDS, 1 OSS, 1 client) • Xrootd: 3 nodes (1 manager, 2 servers) • Xrootd II: 3 nodes (1 manager, 2 servers) • Development machine • Installation testing machine
Virtual testing infrastructure • 23 nodes total • only 2 physical servers running virtualization software (OpenVZ and Xen) • fast deployment and reconfiguring of nodes as required • performance is not a deciding factor
Results and plans • The project is nearing completion • Most modules are done • Proof and XRootD modules already testing on real clusters • Next steps: • Message consumers • OGE • Testing and support • Data transfer monitoring project