Download
1 / 16
160 likes | 380 Vues
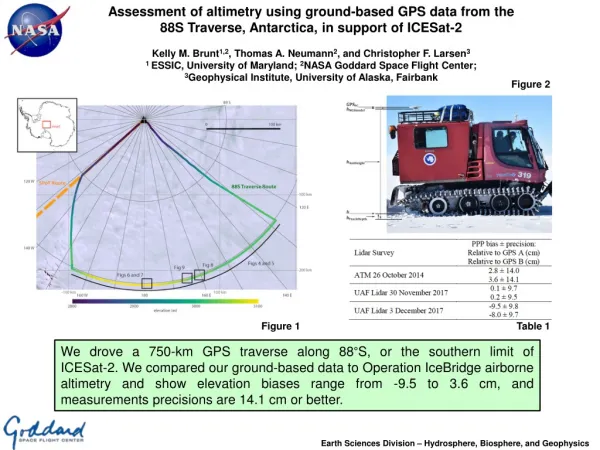
Estimation of Net Community Production (NCP) Using O 2 / Ar Measurements and Satellite Observations. Zuchuan Li, Nicolas Cassar Division of Earth and Ocean Sciences Nicholas School of the Environment Duke University. Overall objective.

E N D
Estimation of Net Community Production (NCP) Using O2/Ar Measurements and Satellite Observations Zuchuan Li, Nicolas Cassar Division of Earth and Ocean Sciences Nicholas School of the Environment Duke University
Overall objective • Develop an independent estimate of global Net Community Production (NCP) • A large independent training dataset : O2/Ar-derived NCP • Satellite observations • Statistical methods: • Support Vector Regression • Genetic Programming • Compare to current algorithms of export production
Examples of current export production algorithms • Laws et al. (2000) • Dunne et al. (2005 & 2007) ef-Ratio NPP SST Export production ~ NPP * Export ratio 0.04 < pe-ratio < 0.72
O2/Ar-derived NCP Atmosphere NCP ~ Δ[O2]biosat*gas exchange coefficient Photosynthesis (GPP) Organic matter + O2 CO2 Auto- & hetero- trophic respiration NCP Base of the mixed layer • NCP • Gross Primary Production (GPP) – Community respiration • Net Primary Production (NPP) – Heterotrophic respiration • NCP estimation • O2/Ar measurements • Satellite observations (e.g. NPP and SST) • Uncertainties in O2/Armeasurements • See Reuer et al. 2007, Cassar et al. 2011, Jonsson et al. 2013
Total O2/Ar Observations N = 14795 (9km) Satellite match observations N = 3874 Filter with Rossby Radius N = 722 • SeaWiFS • NPP (from VGPM) • POC • Chl-a • phytoplankton size structure (Li et al. 2013) • Rrs(λ) • PAR • Others • SST • Mixed-layer depth (Hosoda et al. 2010)
NCP vs. satellite observations • Increases with productivity and biomass: • NPP • POC • Chl-a • Displays nonlinearity and scatter • Decreases trend with: • SST
Statistical algorithms Genetic programming (Schmidt and Lipson 2009) Support vector regression (Vapnik 2000) Theory: Search for a nonlinear model within an error and as flat as possible Input: NPP, Chl-a, POC, SST Output: Implicit model • Theory: Search for the form of equations and their coefficients • Input: NPP, Chl-a, POC, SST … • Output: Equations
Model validation • Equation from genetic programming: Genetic Programming Support Vector Regression Predicted NCP Predicted NCP Predicted NCP Observed NCP Observed NCP Observed NCP NCP has units of (mmol O2 m-2 day-1)
Comparison • Eppley: Eppley and Peterson (1979) • Betzer: Betzer et al. (1984) • Baines: Baines et al. (1994) • Laws: Laws et al. (2000) • Dunne: Dunne et al. (2005 & 2007) • Westberry: Westberry et al. (2012) • This study (GP): genetic programming • This study (SVR): support vector regression
Differences between algorithms • Consistent regions: • North Atlantic • North Pacific • Region around 45o S • Regions with large discrepancy: • Oligotrophic gyres • Southern Ocean • Arctic Ocean • Possible reasons: • Limited observations • Different • Field methods • Measured properties • Uncertainties in satellite products ([Chla], NPP (VGPM), etc.) (CV: coefficient of variation)
Comparison with Laws et al. 2000 • GP(this study)/Laws • Consistent in most regions • Our algorithm predicts higher NCP in: • Southern Ocean • Transitional regions GP(this study)/Laws
Conclusions • Our method shows a relatively good agreement to other models • With a completely independent training dataset and scaling methods • However: • Our algorithms predict more uniform carbon fluxes in the world’s oceans • Discrepancies are observed in some regions, such as Southern Ocean where our algorithms generally predict higher NCP • Work in progress… • Develop region specific algorithms • Test consistency of the genetic programming solutions and transferability • Test with additional datasets
Acknowledgements • All of our O2/Ar collaborators for providing the field observations Thank you!
Dissolved O2/Ar-based NCP • O2/Ar measurement • [O2] contributed to biological process • NCP
O2/Ar-based NCP measurement Atmosphere NCP = D[O2]sat*gas exchange coefficient NCP = Net (POC + DOC) change NCP=Photosynthesis-Respiration Base of the mixed layer • Assumptions, Limitations, Uncertainties: • No mixing across base of mixed layer • Steady-state (see Hamme et al. 2012) • Restricted to the whole mixed layer • Gas exchange parameterized in terms of windspeed • Argon: Inert gas which has similar solubility properties as oxygen
Validation • Genetic programming • A: • B: • C: