Statistical Analysis and Process Capability for Quality Improvement
Learn about statistical analysis, operational definitions, process capability, histograms, and more for enhancing quality processes in your organization. Get practical tools and techniques to measure performance and make informed decisions.

Statistical Analysis and Process Capability for Quality Improvement
E N D
Presentation Transcript
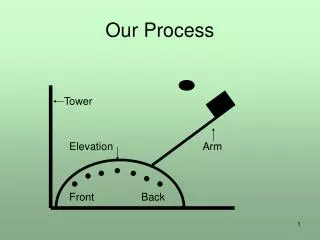
Our Process Tower Elevation Arm Front Back
Operational Definition • Need two things: • a method of measurement or test • a set of criteria for judgment • For example, what are operational definitions for the following: • on-time delivery • good service • 50% wool blanket source: Moen, Nolan and Provost, Improving Quality Through Planned Experimentation
Data Collection • Collect 5 data points for each team member • Plot run chart (use chart wizard) • Construct a histogram (Data | Data Analysis | Histogram) • Construct a box and whiskers plot (use box&whiskers.xls) • Calculate x-bar and s (Data | Data Analysis | Descriptive Statistics) • Discuss results and be prepared to brief results to other groups
Data | Data Analysis Descriptive Statistics Histogram
Insert | Line Chart Box and Whiskers XLS
What the Exercise Statistics Reveal • The sample mean (x-bar) describes typical distances in one number. • Other measures of central tendency include: median and mode. • The sample standard deviation (s) provides a measure of the ‘average’ deviation around the mean.
Using x-bar and s • The empirical rule assumes the underlying distribution is normal: • 68% within ± 1 s • 95% within ± 2 s • 99 % within ±3 s • For any distribution: • At least 75% within ± 2 s • At least 89% within ± 3 s
Histograms • Shows the distribution of process outcomes. • Look for center, shape and spread • Compare to: • your expectations and knowledge • target and specification requirements • across shifts, operators, machines, etc
Process capability EXCEL: =Normdist(x, mean, std dev, 1) to calculate percent non-conforming material.
X-3sA X X-1sA X-2sA X+3sA X-6sB X X+6sB X+2s X+1sA • Estimate standard deviation: • Look at standard deviation relative to specification limits • Don’t confuse control limits with specification limits: a process can be out of control, yet be incapable = / d s ˆ R 2 The Statistical Meaning of Six Sigma Process capability measure Upper Specification Limit (USL) Lower Specification Limit (LSL) Process A (with st. dev sA) x Cp P{defect}ppm 1 0.33 0.317 317,000 2 0.67 0.0455 45,500 3 1.00 0.0027 2,700 4 1.33 0.0001 63 5 1.67 0.0000006 0,6 6 2.00 2x10⁻⁹ 0,00 3 Process B (with st. dev sB)