Download
1 / 8
100 likes | 644 Vues
Lab #8 - Wattsville Map (Analyzing the Mercalli Scale).

E N D
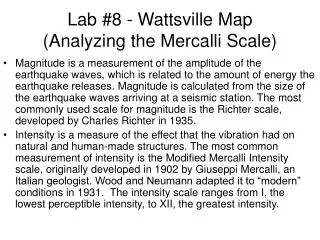
Lab #8 - Wattsville Map(Analyzing the Mercalli Scale) • Magnitude is a measurement of the amplitude of the earthquake waves, which is related to the amount of energy the earthquake releases. Magnitude is calculated from the size of the earthquake waves arriving at a seismic station. The most commonly used scale for magnitude is the Richter scale, developed by Charles Richter in 1935. • Intensity is a measure of the effect that the vibration had on natural and human-made structures. The most common measurement of intensity is the Modified Mercalli Intensity scale, originally developed in 1902 by Giuseppi Mercalli, an Italian geologist. Wood and Neumann adapted it to “modern” conditions in 1931. The intensity scale ranges from I, the lowest perceptible intensity, to XII, the greatest intensity.
This activity will be using data adapted from reports of an earthquake that struck California in 1971. • Directions: • Read over Mercalli Scale descriptions • Read KWAT Television Script • Look over the map in the lab and locate all places mentioned in the script • Each caller in the script is calling from a different are on the map • For each call, label each area a value from the Mercalli Scale based on the damage reported from the caller • When done with labels, draw bold lines enclosing areas with equal intensity ratings to develop an isoseismal map (a series of concentric lines.)
Caller 1: “Hi, this is Charles from the hospital. Everyone ran outdoors and we only had moderate damage thanks to a well-built building.” VII VII. Everybody runs outdoors. Damage negligible in buildings of good design and construction; slight to moderate damage in well-built ordinary structures; considerable in poorly built or badly designed structures; some chimneys broken. Noticed by persons driving cars.
Example of an isoseismal map (a series of concentric lines.)
This activity they will be using data adapted from reports of an earthquake that struck California in 1971. • Directions: • Read over Mercalli Scale descriptions • Read KWAT Television Script • Look over the map in the lab and locate all places mentioned in the script • Each caller in the script is calling from a different are on the map • For each call, label each area a value from the Mercalli Scale based on the damage reported from the caller • When done with labels, draw bold lines enclosing areas with equal intensity ratings to develop an isoseismal map (a series of concentric lines.) VII
Grading Guidelines: • Lines should look close to what you see in the image to the left • The Roman Numerals should be the same as the ones to the left and in the right location • How To Grade: • Lines in correct position = 10 points • Roman Numerals correct = 21 points • Total for lab = 31 points