
Uploaded by
reilly
0 SLIDES
189 VUES
0LIKES
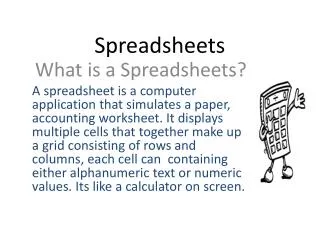
Excel Magic: Unleash the Power of Spreadsheets
DESCRIPTION
Dive into the world of spreadsheets with Mynde, Sean Daley, and the intriguing Zombie John as they showcase the multitude of functions available. Discover how spreadsheets can store data, sort information, perform calculations, create engaging graphs and charts, validate data, and use macros to navigate seamlessly. Learn the art of maximizing the capabilities of spreadsheets for enhanced productivity and analysis.
Download

1 / 0
Download Presentation

Télécharger la présentation
Excel Magic: Unleash the Power of Spreadsheets
An Image/Link below is provided (as is) to download presentation
Download Policy: Content on the Website is provided to you AS IS for your information and personal use and may not be sold / licensed / shared on other websites without getting consent from its author.
Content is provided to you AS IS for your information and personal use only.
Download presentation by click this link.
While downloading, if for some reason you are not able to download a presentation, the publisher may have deleted the file from their server.
During download, if you can't get a presentation, the file might be deleted by the publisher.
E N D
Presentation Transcript
-
Spreadsheets
Mynde Sean Daley And maybe zombie john - What can a spreadsheet do Store data Sort data Make calculations Make graphs and charts Data validation Use macros to navigate to other pages or places of the spreadsheet Spreadsheet s allows us to collect data and then calculate this data using formulas. A spreadsheet can create a various amount of charts and graphs from varying range of data. A spreadsheet is arranged in rows and columns.
- Who are the main users of spreadsheets Accountants – They need to keep track of all the money coming into the business and all the payments going out. Teachers – Need to keep track of marks given for homework ect. Engineers – Need to perform calculations when designing bridges, buildings, aeroplanes, cars ECT. sales people – They use spreadsheet to keep track of the items they sell. The main users of spreadsheets would be business organizations and also schools and colleges
- How can spreadsheets be used to solve problems? The way that spreadsheets solve problems is by using formulas. Excel has input functions that allow you to calculate data such as SUM and COUNT. The way that spreadsheets solve complex problems is by using a variety of formulas which allows quick and accurate calculations by using a range of fields. Also pivot tables and also by using what IF scenarios can be used.
- How can organisations use interpretation methods to analyse data? It analyses data by using charts, such as pie, line and bar charts. These charts can display patterns and trends. With charts and trends businesses are able to analyse data. These include pie charts, bar charts and line graphs. Organizations are able to tell very easily between patterns and trends and are easily able to make these charts and graphs by using the chart wizard that is integrated within MS Excel.


More Related
Audio
Live Player