Download
1 / 21
220 likes | 569 Vues
HDI and its neglect in Pakistan. HDI . The index was developed by Pakistan economist Dr. Mahboob ul Haq , Sir Richard Jolly/ Amartya Kumar Sen with the help of Gustav Renis of Yale University and Lord Meghnad Desai of London School of Economics.

E N D
HDI • The index was developed by Pakistan economist Dr. MahboobulHaq, Sir Richard Jolly/Amartya Kumar Sen with the help of Gustav Renis of Yale University and Lord Meghnad Desai of London School of Economics. • Used by UNDP in its human development reports since then • The HDI uses measures of life expectancy, literacy, education attainment, and GDP per capita for countries world wide
HDI • The basic use of HDI is a composite measure of a country’s development (life expectancy, education and living standard) • Life expectancy at birth, a measure of pop health and longevity. • Education and knowledge as measured by adult literacy rate with 2/3 weighting and the combined primary, secondary and tertiary rate with 1/3 ratio • Living standard as measured by GDP per capita at purchasing power parity in US$
Formula • In general to transform a raw variable say (x) into a unit free index b/w 0-1 (which allows indices to be added together) the following formula is used: • X index = x - max (x)/ max (x)-min (x) • Min(x), Max (x), are minimum and maximum values x can attain • The HDI then represent the average of the following three indices: Source: http://www.slideshare.net/Milanregmi/hdi-17271295
Formula for HDI • Life expectancy index = LE-20/90-20 • Education index = 2/3 x ALR + 1/3 General • Adult literacy rate = ALR-0/100-0 • Gross enrollment index (GEI) = CGER-0/100-0 • GDP index = log (GDP pc)- log(100)/Log (40000)-log (100) • HDI = Education index + health index + economic index/3
Pakistan HDI trend in the region A reviews Pakistan’s progress in each of the HDI indicators. Between 1980 and 2012, Pakistan’s life expectancy at birth increased by 7.8 years, mean years of schooling increased by 3.1 years and expected years of schooling increased by 3.7 years. Pakistan’s GNI per capita increased by about 94 percent between 1980 and 2012.
Pakistan HDI trend in the region • Pakistan’s HDI value for 2012 is 0.515—in the low human development category—positioning the country at 146 out of 187 countries and territories. The rank is shared with Bangladesh. Between 1980 and 2012, • Pakistan’s HDI value increased from 0.337 to 0.515, an increase of 53 percent or average annual increase of about 1.3 percent.
Pakistan HDI trend in the region • Pakistan’s HDI for 2012 is 0.515. However, when the value is discounted for inequality, the HDI falls to 0.356, a loss of 30.9 percent due to inequality in the distribution of the dimension indices. India and Bangladesh, show losses due to inequality of 29.3 percent and 27.4 percent respectively. The average loss due to inequality for low HDI countries is 33.5 percent and for South Asia it is 29.1 percent. • Long-term progress can be usefully assessed relative to other countries–both in terms of geographical location and HDI value. For instance, during the period between 1980 and 2012 Pakistan, India and Bangladesh experienced different degrees of progress toward increasing their HDIs.
Pakistan HDI trend in the region • Pakistan has a GII value of 0.567, ranking it 123 out of 148 countries in the 2012 index. In Pakistan, 21.1 percent of parliamentary seats are held by women, and 18.3 percent of adult women have reached a secondary or higher level of education compared to 43.1 percent of their male counterparts. • For every 100,000 live births, 260 women die from pregnancy related causes; and the adolescent fertility rate is 28.1 births per 1000 live births. Female participation in the labour market is 22.7 percent compared to 83.3 for men.
Multidimensional Poverty Index (MPI) • The 2010 HDR introduced the Multidimensional Poverty Index (MPI), which identifies multiple deprivations in the same households in education, health and standard of living. • The most recent survey data available for estimating MPI figures for Pakistan were collected in 2006/2007. In Pakistan 49.4 percent of the population lived in multidimensional poverty (the MPI ‘head • count’) while an additional 11 percent were vulnerable to multiple deprivations. • The intensity of deprivation – that is, the average percentage of deprivation experienced by people living in multidimensional poverty – in Pakistan was 53.4 percent. • The country’s MPI value, which is the share of the population that is multi-dimensionally poor adjusted by the intensity of the deprivations, was 0.264. • India and Bangladesh had MPI values of 0.283 and 0.292 respectively.
Multidimensional Poverty Index (MPI) • Income poverty, measured by the percentage of the population living below PPP US$1.25 per day, and multidimensional deprivations in Pakistan. It shows that income poverty only tells part of the story. • The multidimensional poverty headcount is 28.4 percentage points higher than income poverty. This implies that individuals living above the income poverty line may still suffer deprivations in education, health and other living conditions. • The percentage of Pakistan’s population that live in severe poverty (deprivation score is 50 percent or more) and that are vulnerable to poverty (deprivation score between 20 and 30 percent). The contributions of deprivations in each dimension to overall poverty complete a comprehensive picture of people living in poverty in Pakistan. • Source: UNDP (2012)
Gender Inequality Index (GII) reflects gender-based inequalities in three dimensions reproductive health, empowerment, and economic activity.
Comparison of adult literacy rate for ten years and older within the provinces of Pakistan
Motivation toward education • Otherpositiveoutcomes of education • Reduction in povertyandinequality • Improvement in health status • Good governance in implementation of socio-economic policies • Multifaceted impact of education makes it an essential element for policy framework
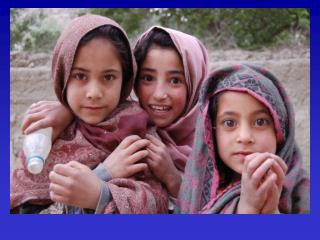
Education system of Pakistan Problem: Low literacy and school enrollment rates in Pakistan