1 / 19

Part 2 Exploratory Data Analysis Chapter 2 Summarising Data: Summary Tables and Graphs

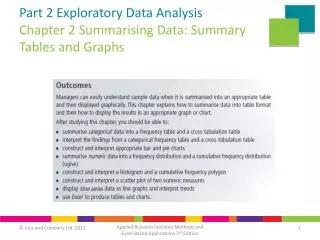
Part 2 Exploratory Data Analysis Chapter 2 Summarising Data: Summary Tables and Graphs. Introduction. Summarising Categorical Data Single Categorical Variable. Summarising Categorical Data continued Two Categorical Variables. Summarising Numeric Data Single Numeric Variable.

renate
Télécharger la présentation

Part 2 Exploratory Data Analysis Chapter 2 Summarising Data: Summary Tables and Graphs

An Image/Link below is provided (as is) to download presentation Download Policy: Content on the Website is provided to you AS IS for your information and personal use and may not be sold / licensed / shared on other websites without getting consent from its author. Content is provided to you AS IS for your information and personal use only. Download presentation by click this link. While downloading, if for some reason you are not able to download a presentation, the publisher may have deleted the file from their server. During download, if you can't get a presentation, the file might be deleted by the publisher.

E N D

Presentation Transcript


  1. Part 2 Exploratory Data AnalysisChapter 2 Summarising Data: Summary Tables and Graphs

  2. Introduction

  3. Summarising Categorical Data • Single Categorical Variable

  4. Summarising Categorical Data continued • Two Categorical Variables

  5. Summarising Numeric Data • Single Numeric Variable

  6. Summarising Numeric Data continued • Two Numeric Variables

  7. The Pareto Curve

  8. Using Excel (2007) to Produce Summary Tables and Charts

  9. Summary • Exercises

  10. End of Chapter 2 Applied Business Statistics Methods and Excel-based ApplicationsThird edition TREVOR WEGNER ISBN 978-0-70217-774-3

More Related