Download
1 / 18
180 likes | 324 Vues
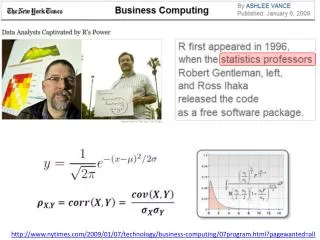
http://www.nytimes.com/2009/01/07/technology/business-computing/07program.html?pagewanted=all. Workspace Fewer Lines of Code Efficiency Capability. Package Code Documentation Datasets. Source Code Tons of Lines of Code Simplified. Data Structures. character vector. numeric vector.

E N D
http://www.nytimes.com/2009/01/07/technology/business-computing/07program.html?pagewanted=allhttp://www.nytimes.com/2009/01/07/technology/business-computing/07program.html?pagewanted=all
Workspace • Fewer Lines of Code • Efficiency • Capability • Package • Code • Documentation • Datasets • Source Code • Tons of Lines of Code Simplified
Data Structures character vector numeric vector Dataframe: d <- c(1,2,3,4)e <- c("red", "white", "red", NA)f <- c(TRUE,TRUE,TRUE,FALSE)mydata <- data.frame(d,e,f)names(mydata) <- c("ID","Color","Passed") List: w <- list(name="Fred", age=5.3) Numeric Vector: a <- c(1,2,5.3,6,-2,4) Character Vector: b <- c("one","two","three") Framework Source: Hadley Wickham Matrix: y<-matrix(1:20, nrow=5,ncol=4)
Integrated Development Environment (IDE) • Write Code/ Program • Input Data • Analyze • Graphics Datasets, etc. Enter Commands View Results
R Installation Already Includes Several Libraries Workflow Data Analysis Goals Input a Comma Separated Values Data Input Enter Manually Data Management Combine Variables Add Variable Select a Subset Statistics & Analysis Visualization & Reporting
Sample Script (1) Data Input (2) Statistical Function (3a) Graphical Parameters (3b) Plot Function
Currently, how many R Packages? At the command line enter: • dim(available.packages()) • available.packages()
Course Some Coverage Specialized “Domain” stats graphics (both built-in) Bayesian DifferentialEquations Econometrics Environmetrics ExperimentalDesign Finance Genetics HighPerformanceComputing MachineLearning MedicalImaging NaturalLanguageProcessing Pharmacokinetics Phylogenetics Psychometrics SocialSciences Spatial TimeSeries Data Management plyr reshape Graphics ggplot2
R Packages have been created that are equivalent to the functionality of SAS and SPSS
Packages for reading, writing for various data sources and file formats XLConnect sas7bdat Comma Separated Variables Hmisc foreign XML RMySQL RODBC / ROracle RJSONIO RWeka rhbase Rcpp
The R Graphics Package library(help="graphics") • Graphing Parameters • Basic Chart Types Titles X-Axis Title Y-Axis Title Legend Scales Color Gridlines
Correlations Matrix library(car) scatterplotMatrix(h)
The next data visual was produced with about 150 lines of R code