We learned
Becoming Fluent in Information Technology By Monica Pelayo. Computational Thinking. In CSE 3, we learned Information Technology fluency. We also learned programming with HTML and the use of applications. Through these, we learned problem solving and reasoning. In Alice, we learned

We learned
E N D
Presentation Transcript
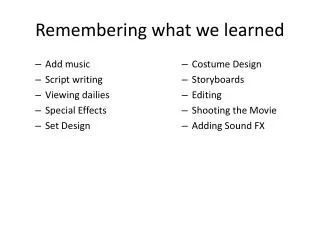
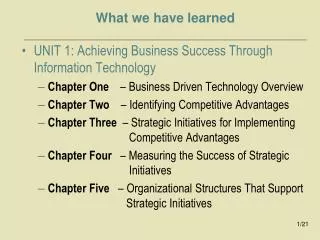
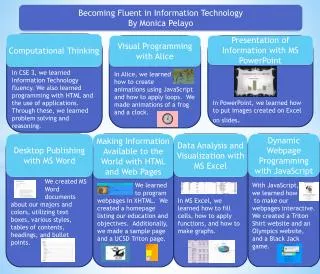
Becoming Fluent in Information Technology By Monica Pelayo Computational Thinking In CSE 3, we learned Information Technology fluency. We also learned programming with HTML and the use of applications. Through these, we learned problem solving and reasoning. In Alice, we learned how to create animations using JavaScript and how to apply loops. We made animations of a frog and a clock. Visual Programming with Alice We learned to program webpages in XHTML. We created a homepage listing our education and objectives. Additionally, we made a sample page and a UCSD Triton page. Making Information Available to the World with HTML and Web Pages In PowerPoint, we learned how to put images created on Excel on slides. Presentation of Information with MS PowerPoint Dynamic Webpage Programming with JavaScript We created MS Word documents about our majors and colors, utilizing text boxes, various styles, tables of contents, headings, and bullet points. Desktop Publishing with MS Word In MS Excel, we learned how to fill cells, how to apply functions, and how to make graphs. Data Analysis and Visualization with MS Excel With JavaScript, we learned how to make our webpages interactive. We created a Triton Shirt website and an Olympics website, and a Black Jack game.