
STRAVA Spatial Data and Processes:
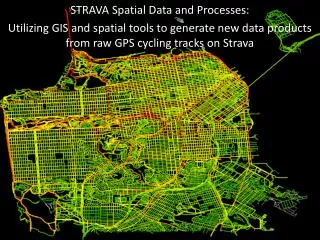
STRAVA Spatial Data and Processes: Utilizing GIS and spatial tools to generate new data products from raw GPS cycling tracks on Strava. Strava’s Big Spatial Data. 125+ million activities 300+ billion GPS points 60% international. Strava Labs Projects. How did the Geo Pod come to be?.

STRAVA Spatial Data and Processes:
E N D
Presentation Transcript
STRAVA Spatial Data and Processes: Utilizing GIS and spatial tools to generate new data products from raw GPS cycling tracks on Strava
Strava’s Big Spatial Data 125+ million activities 300+ billion GPS points 60% international Strava, Inc. 2014
Strava Labs Projects Strava, Inc. 2014
How did the Geo Pod come to be? Geo Reporting Bad GPS data Segment corrections www.strava.com/routes Geo Team was created Strava, Inc. 2014
Strava Metro Quick Timeline Data requests in early 2012 Planning, Research, Big Data Raw data No raw data sold or provided to groups Strava Metro was born and first release to Oregon DOT on February 12, 2014 Strava, Inc. 2014
Huge Amounts of Data Needed:What can GEO/GIS fill in? • Restaurant Dev zones • Where do cyclist spend Money • Difference between men and women cyclists? • Bike peer-networks • Bike new or used • % restaurant sales by bike • How to gather feedback on design elements • Perceived dangerous or challenging areas • What is the mode share by street segments • Where do people ride vs where do the want to ride • bike ownership rates by location and demographics • Where are bikes stored • Bike purchasing after bike share opens • Heath insurance for those who work on a bike • Bike theft data • Crash data based on cause/mode • Bikes on transit • Perception of bikes and bicyclists • Locations of cycling habitat fragmentation • Perception of safety on various faculties • Bike tire and accessory sales data • What is the rate of adoption • Loner bike for visitors • Patterns of usage that suggest better, safer ways of designing streets • Bike share routes vs. bike network • Where are bikes parked • Health of riders over time • Locations of near-misses and close calls • Cycling demo- who is riding • Cycling lanes not used • Lidar of street surface • Traffic counters • % of journeys on bike lanes • Free indoor parking? • Structure, qualitive rating of route or route segment • What makes new bike commuters starts? • How many people starting or re-starting riding because of bike share Strava, Inc. 2014
Who is Strava? Strava has grown into the leading online cycling and running community Our members cross all types of demographics Urban area uploads are around 40% commute Who makes up San Francisco Strava? • Athlete ID Count: 23,714 • Activity Count: 394,883 • Average Distance: 28,904 m • Median Distance: 19,409 m • Average Time: 6,442 sec • Median Time: 4,188 sec • Commute Counts: 183,155 • Male Count: 18,511 • Male Count Under 25: 670 • Male Count 25 - 34: 5,826 • Male Count 35 - 44: 5,145 • Male Count 45 - 54: 3,444 • Male Count 55 - 64: 1,129 • Male Count 65 - 74: 243 • Male Count 75 - 84: 22 • Male Count 85 - 94: 19 • Male Count No Bday: 2,004 • Female Count: 3,705 • Female Count Under 25: 123 • Female Count 25 - 34: 1,501 • Female Count 35 - 44: 841 • Female Count 45 - 54: 448 • Female Count 55 - 64: 166 • Female Count 65 - 74: 30 • Female Count 75 - 84: 1 • Female Count 85 - 94: 1 • Female Count No Bday: 591 • Blank Gender Count: 1,498 Strava, Inc. 2014
Locating Commutes Strava, Inc. 2014
Strava Metro is a Custom Built Product Vector GIS polyline Layers Basemap is user dependent (OSM, TomTom, City Provided) AM/PM commute times On and Off Season Polygon tables: Census Blocks, zip codes, wards or custom City Bike & CycleTracks GPS Tracks Integration Strava, Inc. 2014
Core Strava Metro Files Strava, Inc. 2014
Minute View Strava, Inc. 2014
Rolled Up View Strava, Inc. 2014
Filtering by Commutes Strava, Inc. 2014
Origin/Destination Matrix Strava, Inc. 2014
Spatial Movement by Zones Strava, Inc. 2014
Node Wait Times Strava, Inc. 2014
Intersection Based Data Strava, Inc. 2014
Strava Metro: The Big Picture Strava, Inc. 2014
Strava Metro Infrastructure Change Adoption Strava, Inc. 2014
Net Gain & Loss Strava, Inc. 2014
Weekend vs Weekday Use Strava, Inc. 2014
Peak Riding Times and Days Strava, Inc. 2014
Strava Correlation: Oregon Sample Strava, Inc. 2014
Web Interface: OD and Streets Example Strava, Inc. 2014
Missing Cycling Corridors Strava, Inc. 2014
Final Metro Points Strava is receiving over 3 million uploads a week and has doubled every year Strava is free to download/use, ad free and available on Iphone and Android phones Strava’s apps are translated in 13 languages and the website in 5 Strava GEO is pushing the edge of providing critical cycling data to planning groups Strava, Inc. 2014
Animation Time http://vimeo.com/102942524 https://www.youtube.com/watch?v=QZ5DuQTUPqk&list=UUdO8l6B6yeRDcsP1snssTPw Strava, Inc. 2014