Download
1 / 21
210 likes | 342 Vues
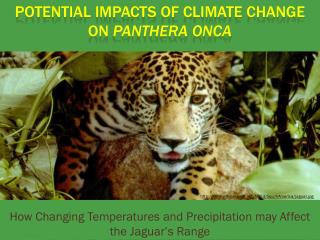
Potential Impacts of Climate Change on Vegetation in the Appalachian LCC. Patrick Jantz, Tina Cormier, Scott Zolkos, Scott Goetz and the LCCVP Group NASCB July 10, 2014 Missoula, MT. Photo credit: Andri Kyrychok. Appalachian LCC. Appalachian LCC. Approach.

E N D
Potential Impacts of Climate Change on Vegetation in the Appalachian LCC • Patrick Jantz, Tina Cormier, Scott Zolkos, Scott Goetz and the LCCVP Group NASCB July 10, 2014 Missoula, MT Photo credit: AndriKyrychok
Approach • Summarize existing species distribution model results for the eastern U.S. (Iverson et al. 2008, McKenney et al. 2011) • Summarize projected climate in terms of historical range of variability for target NPS units • Ecosystem process models to gain insight into the nature of climate change induced stressors • Bioclimatic envelope modeling for major vegetation types • Bioclimatic envelope modeling for individual species
Published species distribution models (Iverson et al. 2008, McKenney et al. 2011) Zolkos et al. in review Decline in habitat richness of 32 key tree species
Shenandoah Projected Climate • Results are similar for other NPS units
Ecosystem Process Projections • Results are similar for other NPS units
Reference or training data: Field observations of target species or map of vegetation types, e.g. biomes, communities. Predictors: stack of ecologically relevant variables (e.g., climate, soil type, etc.). Bioclimatic Envelope Model (aka SDM) Estimates and projections: apply models to current or projected conditions Probability of presence or suitability estimates Current suitability Future suitability time 1 Future suitability time 2 . . . time n.
Envelope Modeling for Vegetation Types Our objective is to use bioclimatic envelope models as “ecologically scaled metrics of the extent and nature of projected climate change” (Jackson et al. 2009) in support of vulnerability assessment. Response variable: NPS/USGS vegetation map gridded to 800m cells represents suitability for vegetation types Predictors: NEXDCP30 gridded climate, STATSGO soils, potential relative radiation, twi
Cove Forest Current modeled – park only Current Mapped Current modeled – rangewide 2050 modeled – park only 2050 modeled – rangewide
Conclusions • Preliminary results from veg. distribution models, ecosystem process models, plus synthesis of existing distribution models point to significant shifts in forest communities as a result of climate change. • Cove Forest models indicate that topoclimates need better representation • Next step to use these results to help identify areas within NPS units where species/communities may persist longest and which may be high management priorities.
Thanks! • We acknowledge support from NASA Climate and Biological Response grant NNH10ZDA001N Photo credit: AndriKyrychok
INPUT: Fine scale NPS vegetation map represents ES suitability OUTPUT: ES-level %cover/habitat suitability map + INPUT: Bioclimatic variables (e.g., max temp of warmest month) Use veg classification to calculate %cover in each larger pixel
Recent Historical Trends 10 year moving average of annual minimum temperature