Download
1 / 26
260 likes | 415 Vues
Overweight Children. Ate fewer fruits and vegetables (2.9 vs. 3.3/day) Drank more sweetened beverages (1.3 vs. 1.1/day) Ate more high-fat snacks (64 vs. 56 %; p=0.054) Ate more fast food (1.4 vs. 1.1/week; p=0.051) Spent more screen time (101 vs. 81 minutes)

E N D
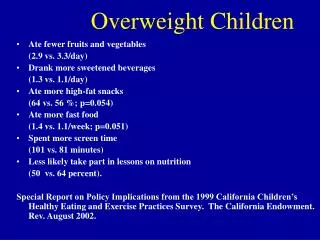
Overweight Children • Ate fewer fruits and vegetables (2.9 vs. 3.3/day) • Drank more sweetened beverages (1.3 vs. 1.1/day) • Ate more high-fat snacks (64 vs. 56 %; p=0.054) • Ate more fast food (1.4 vs. 1.1/week; p=0.051) • Spent more screen time (101 vs. 81 minutes) • Less likely take part in lessons on nutrition (50 vs. 64 percent). Special Report on Policy Implications from the 1999 California Children’s Healthy Eating and Exercise Practices Survey. The California Endowment. Rev. August 2002.
Impact of leptin treatment on body weight in patient with leptin deficiency O‘Rahilly S. et al Endocrinology 2003; 144:3757-3764.
Body weight control in humans Zigman J. et al., Endocrinology 2003, 144:3749-3756.
Treatment Protocols for Type 2 Diabetes in Youth -A Multidisciplinary Approach • Set Glycemic Targets • A1c < 7% • Diabetes Education • Patient and Family • Role of Intensive Lifestyle • Pharmacotherapy • Regimens Advocated
ROLE OF FAMILY IN MANAGEMENT • African-American Family Study • Group 1, direct family supervision • Group 2, no direct supervision • Group 1 ending HbA1c = 7.1+ 0.8% • Group 2 ending HbA1c = 12.3 + 0.6% • P=<0.0005 Bradshaw, J Pediatr Endocrinol Meta 15, 2002
Organizations & Institutions Community/Neighborhood Media Law Insurers Home Visitation Friends/Family Parent, Infant, Child Coworkers Fathers Health Care Providers Public Parks Child Care Popular Culture Neighbors Friends Hospitals Family Employer Public Education Lactation Specialists Professional Education
Silverstein, Rosenbloom J Pediatr Endcrinol Metab, 13,2000 Diagnosis BG 250 mg/dL Asymptomatic Start with insulin and diet, exercise Diet and exercise <7% <7% Monthly review, A1c q3 m Add Metformin Attempt to Wean insulin >7% Add metformin >7% Add insulin, TZD, sulfonylurea >7% Add 3rd agent
HbA1c cohort, median data
TYPE 2 DIABETES . . . A PROGRESSIVE DISEASE Progressive Decline of -Cell Function in the UKPDS 100 80 60 -Cell Function (% ) 40 20 0 10 9 8 7 6 5 4 3 2 1 0 1 2 3 4 5 6 Years Adapted from UK Prospective Diabetes Study (UKPDS) Group. Diabetes. 1995; 44:1249-1258. 6-4
Conservative management of glycaemia:traditional stepwise approach OAD + multiple dailyinsulin injections Diet OAD monotherapy OAD monotherapyup-titration OAD combination OAD + basal insulin 10 9 HbA1c (%) 8 7 6 Duration of diabetes • Adapted from: Campbell IW. Br J Cardiol 2000; 7:625–631.
Proactive management of glycemia:early combination approach Diet OAD monotherapy 10 Empire Study: Rosiglitazone + Metformin OAD combinations OADs uptitration 9 OAD + basal insulin OAD + multiple daily insulin injections HbA1c (%) 8 7 6 Duration of diabetes
600 25 500 20 400 Insulin (pmol/l) 15 Glucose (mmol/l) 300 10 200 100 5 0 0 0 15 30 60 90 120 180 0 15 30 60 90 120 180 Time (min) before insulin therarpy immed.after insulin therapy 1-year follow-up Short-term therapy in newly diagnosed diabetes Edmond Ryan, Diabetes Care Vol. 27, Num.5, May 2004
Glyburide Insulin D C-Peptide in Newly-Diagnosed Type 2 DiabeticsTreated with Insulin (30/70 bid) vs. Glyburide 0,3 § 0,2 # 0,1 DC-Peptide (nmol/L) 0,0 -0,1 * -0,2 -0,3 day 1 2 1 2 year 1 2 Alvarsson M et al, Diabetes Care, 2003
Rosiglitazone: effects on tissue triglyceride accumulation Reduces intra-hepatic lipid Improved hepatic function Reduces muscle lipid Rosiglitazone Improved muscle function Reduces intra islet lipid Improved b-cellfunction Arner P. Diabetes Obes Metab 2001; 3 (Suppl 1):11–19.
Rosiglitazone restores -cell insulin content in db/db mice Gly RSG
The Entero-Insular Axis Creutzfeldt W, Diabetologia 1979; 16: 75-85
His Ala Glu Gly Thr Phe Thr Ser Asp Val Ser Lys Ala Ala Gln Gly Glu Leu Tyr Ser Glu Phe Ile Ala Trp Leu Val Gly Arg Gly Lys GLP-1 • Is a peptide hormone (29 amino acids) • Is produced in the small intestine • Is released postprandially • Belongs to the glucagon family • Is a very important incretin hormone
Glucose Amino acids Glucokinase K+ • Synthesis of insulin and secretory machinery • Development and differentiation ATP ADP Ca2+ PKA GEF-II GLP-1 GLP-1 mechanisms at the beta-cell K+ K+ K+ Ca2+ cAMP from: Rorsman & Renstrom, Diabetologia 46, 2003
Upon ingestion of food… GLP-1 Modes of Action in Humans • Stimulates glucose-dependent insulin secretion • Suppresses glucagon secretion • Slows gastric emptying GLP-1 is secreted from the L-cells in the jejunum and ileum • Reduces food intake • Improves insulin sensitivity Long term effectsdemonstrated in animals… This in turn… • Increases beta-cell mass and maintains beta-cell efficiency Drucker DJ. Curr Pharm Des 2001; 7:1399-1412Drucker DJ. Mol Endocrinol 2003; 17:161-171
Pharmakokinetic Problems & Possible Solutions fatty acid side chain (Liraglutide) amino acid exchange (Exendin-4, CJC-131) Cross-linker (CJC-131) amide H A E G T F T S D V S S Y L E G Q A A K E F I A W L V K G R proteolytic degradation (DPP IV) DPP IV-inhibitors Mentlein, Gallwitz, Schmidt 1993, Eur J Biochem; 214: 829-835 Gallwitz et al. 1994, Eur J Biochem; 225: 1151-1156
Exenatide and GLP-1 Amino Acid Sequences: • Exenatide has partial amino acid overlap with GLP-1 • Exenatide and GLP-1 are products from distinct genesin the Gila monster • Exenatide and GLP-1 bind to the known pancreaticGLP-1 receptor in vitro Eng J, et al.J Biol Chem 1992; 267:7402-7405 Chen YQE and Drucker DJ, J Biol Chem 1997; 272: 4108-4115
Met + Sulf + Placebo Met + Sulf + 5 µg exenatide Met + Sulf + 10 µg exenatide Exenatide + Met + Sulf: One Year Preliminary Results From Ongoing, Open-Label Study Controlled Trial Setting Open Label Extension 9.0 10 µg exenatide 8.5 8.0 Mean (±SE) A1C (%) 7.5 7.0 6.5 0 10 20 30 40 50 Time (wk) Interim Completer, N = 237 (Placebo, n = 71; 5 µg exenatide, n = 89; 10 µg exenatide, n = 77) DeFronzo R, et al. ADA 64th Annual Scientific Sessions, June 2004
Met + Placebo Met + 5 µg exenatide Met + 10 µg exenatide * P <0.05 ** P < 0.001ITT, N = 336 (Placebo, n = 113; 5 µg exenatide, n = 110; 10 µg exenatide, n = 113) Exenatide + Met: Change in Body Weight 1 0 -0.3 kg * -1 * Mean (±SE) Change in Weight (kg) -1.6 kg * -2 * ** ** -3 ** -3.7 kg ** -4 0 5 10 15 20 25 30 Time (wk) DeFronzo R, et al. ADA 64th Annual Scientific Sessions, June 2004
Silverstein, Rosenbloom J Pediatr Endcrinol Metab, 13,2000 Diagnosis BG 250 mg/dL Asymptomatic Start with insulin and diet, exercise Diet and exercise <7% <7% Monthly review, A1c q3 m Add Metformin Attempt to Wean insulin >7% Add metformin >7% Add insulin, TZD, sulfonylurea >7% Add 3rd agent