Enron Energy Services
Enron Energy Services. Financial Highlights ($ in Millions). Year to Date. Total Year. Retail Segment Reported. 2001E. 2000. 2001E. 2000. Earnings Before Interest & Taxes 171 79 246 111* Net Income 90 37 127 85 Funds Flow 1 (226) 64 (262)


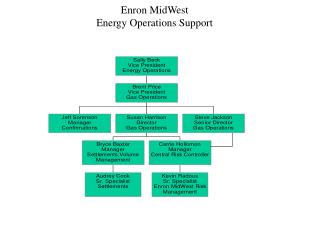
Enron Energy Services
E N D
Presentation Transcript
Financial Highlights($ in Millions) Year to Date Total Year Retail Segment Reported 2001E 2000 2001E 2000 Earnings Before Interest & Taxes 171 79 246 111* Net Income 90 37 127 85 Funds Flow 1 (226) 64 (262) Cash Flow from Operations (102) (257) (39) (350) Capital Deployed 1,103 683 1,097 871 Equity Deployed 662 410 658 523 Return on Equity 18% 12% 19% 16% Results Including Retail Risk Management Capital Deployed 2,748 1,715 2,816 2,117 Return on Equity (33%) 4% (23%) 5% * Non-recurring EBIT of $62 MM
Capital Deployed Year to Date Total Year 2001E 2000 2001E 2000 Accounts Receivable 301 272 301 304 Accounts Payable (132) (70) (132) (161) Other Working Capital, Net 44 111 44 83 Price Risk Management, Net 399 79 461 229 PP&E, Net 158 127 167 152 Investments 100 3 92 104 Other 233 161 164 160 Total Capital Deployed 1,103 683 1,097 871
TCV lower in Q3 and Q4E due to large effort on upsells and restructurings and the ramp up in Enron Direct with shorter term smaller deals
Capital DeployedIncluding Retail Risk Management Year to Date Total Year 2001E 2000 2001E 2000 Accounts Receivable 1,402 927 1,402 1,157 P/X Receivables 513 110 513 272 Accounts Payable (303) (280) (303) (357) Other Working Capital, Net 94 88 94 103 Price Risk Management, Net 683 506 842 698 PP&E, Net 158 127 167 152 Investments 100 120 92 104 Other 101 117 9 (12) Total Capital Deployed 2,748 1,715 2,816 2,117
Quarterly Results EBIT (Millions) Total Contract Value (Billions) $246 $30 $225 $75 $23.1 $171 $5.0 $18.1 $71 $5.0 $13.1 $100 $7.2 $60 $5.9 $40 1Q01 2Q01 3Q01E 2001 Plan 1Q01 2Q01 3Q01E 4Q01E 2001 Plan 4Q01E
Pace of Deregulation is Uneven Planned Openings in 2001-2003 Adequate to Meet Near-Term Goals California Crisis Has Increased Urgency in Marketplace and Reduced Acquisition Cost Continued Deregulation is Important to Long-Term Strategy NH VT ME WA 07/07 ND MA 3/02 (C&I) MN NY WI RI SD ID 01/02 CT WY PA IA NJ OH NE 04/02 (C&I) IN DE IL 06/02 UT 01/02 MD CO CA KS MO KY NC TN 11/03 SC 10/03 AZ 07/08 GA AL MS LA 01/02 FL Deregulation Status – U.S. Power Restructuring Legislation/Order Enacted Restructuring Implementation Delayed Commission and/or Legislative Investigation No Significant Activity • $ Market Open = $56.1 Billion • % Market Open = 26% • Total Market Size = $219.0 Billion Restructuring Status as of 10/01
NH WA ME VT MT ND MN OR * NY WI MA SD ID RI MI * WY CT PA IA NJ OH NE DE NV IN IL WV MD UT VA CO KY KS MO CA NC TN SC OK AR AZ NM GA AL MS LA TX FL Deregulation Status – U.S. Gas • Restructuring Varies Greatly by Customer Class and by Utility - Industrial Access Universal • Consumer Response has Varied Greatly • Lack of Urgency in the Market and With Regulators • Gas Needs to Become a Much Larger Product for EES Restructuring Legislation/Order Enacted Restructuring Implementation Delayed Commission and/or Legislative Investigation No Significant Activity • $ Market Open = $31.0 Billion • % Market Open = 51% • Total Market Size = $61.0 Billion Restructuring Status as of 10/01
05/02 Deregulation Status – Canada Power • Alberta Retail Market Opened January 2001 • Ontario Market Expected to Open May 2002 • Ontario Value Proposition Driven by Competition • Most Populous and Industrial Province • Comparable to Energy Intensity of Northeast U.S. • Peak Load of 26,000 MW • $8 Billion in Annual Spend Restructuring Legislation/Order Enacted Restructuring Implementation Delayed Commission and/or Legislative Investigation No Significant Activity • $ Market Open = $1.3 Billion* • % Market Open = 7% • Total Market Size = $19.0Billion Restructuring Status as of 10/01
Deregulation Status – Canada Gas • Ontario has the Primary Value Proposition - Open Access has been Available Since 1985 • British Columbia Market Expected to Open November 2002 • Actively Signing Gas Contracts in Alberta and Ontario • Should be Able to Acquire Market Share Profitably Restructuring Legislation/Order Enacted Restructuring Implementation Delayed Commission and/or Legislative Investigation No Significant Activity • $ Market Open = $7.0Billion • % Market Open = 70% • Total Market Size = $10Billion Restructuring Status as of 10/01
EU Directive Not Implemented Significant Barriers Partially Liberalised Fully Liberalised Deregulation Status – Europe Power • UK and Scandinavian Power Markets Among the Most Competitive in the World • Continental Governments Continue to Thwart EU Electricity Directive • Europe is Becoming a Series of Small Regional Markets • Few, if any, “Pan-European” Accounts • Likely to Lead with the Enron Direct Business Model as EES Enters New Markets on the Continent • $ Market Open = $55.2 Billion • % Market Open = 33% • Total Market Size = $167.0 Billion Restructuring Status as of 10/01
EU Directive Not Implemented Significant Barriers Partially Liberalised Fully Liberalised Deregulation Status – Europe Gas • UK Gas Market Best in Europe • EU Will Not Adopt a New Gas Directive Before 2002 • Continental Gas Incumbents Strongly Defending their Positions • $ Market Open = $21.2 Billion • % Market Open = 30% • Total Market Size = $70.5 Billion Restructuring Status as of 10/01
Limited Market Very Long Sales Cycle / High Acquisition Costs Not Acquiring the “Bundle” Anyway Highly Customized / Not Scalable Challenging Executions Fiduciary Position e.g., IBM Easily Transferable Across Market: Size and Geography Component Assembly Provides the “Illusion” of Customization Bundle or Unbundle Components: Driven by Segment and Profitability Shorter Sales Cycle / Lower Acquisition Costs Standardized Contracts and Components Ensure High Quality Execution and Scalability Easily Tailor Product, Acquisition and Maintenance Model to Channel / Customer e.g., Dell Evolving Business Model “WAS” “IS” Outsourcing Model Product Model
Product-Based Business Process • Products • Power • Natural Gas • Tariff Commodity • DSM • Facility Services • Construction Services • Sales • Large Consumer • Small Consumer • Europe • Canada • Execution • Services • Energy Asset Management • Risk Management • Defines Components, Service Levels and Pricing • Manages Risk, Logistics and Cost • Services Customers • Ensures Quality • Accountable for Execution, Delivery and Maintenance Model • Bundles Components Proactively into Value-Added Products • Designs Products to Ensure Suitability for Customer and Sales Organization • R&D Point • Drives Scale: Ensures Sales Force is Selling Deliverable Products • Ensures Quality and Leverages Good Ideas Across the Entire Sales Organization Quickly • Co-Owns with Sales: Acquisition Model • Define Markets • Target Customers • Originate Business • Create and Manage Sales Channels • Co-Owns with Products: Acquisition Model Goal: Increased Customer Satisfaction, High Quality Product, Scalable Delivery Platform, Higher Velocity and Greater Profitability
Large Consumer Business – U.S. • Annual Energy Spend >$10MM • High Packaging • National Footprint • Enron Sales Force • Dedicated Service Manager YTD Results $172 33 $83 20 $86 $14 14 5 $89 $72 13 9 00 01 00 01 Transactions Gross Margin (Millions) Manufacturing Commercial
Portfolio Origination – U.S. • Upsell Engine • Mines the Existing Customer Portfolio for Value-Added Transactions YTD Results $72 $2 17 1 $70 16 $5 1 00 01 00 01 Transactions Gross Margin (Millions) Manufacturing Commercial
Note that the Direct business (which includes RES) for the first nine months of 2001 generated exactly the same margin as the large consumer business (weird!!)
Small Consumer Business – U.S. • Annual Energy Spend <$10MM • Highly Standardized • Regional • Commissioned Sales Force • Call Center Support YTD Results Channels $172 $201 12,031 $149 8,471 $36 1,803 $52 $16 3,560 $30 $13 1,164 6,439 6 3,009 2,583 639 Direct Telesales / CAD Agent 00 01 00 01 Transactions Gross Margin (Millions) Transactions East Gross Margin(Millions) West
4,545 293 $11.3 133 1,587 $3.9 25 $1 290 13 17 $0.1 June July Aug Sept June July Aug Sept June July Aug Sept Enron Direct – U.S.Agent-Based Business Metrics Agents at Month End Number of Deals Closed by Month Gross Margin by Month(Millions) YTD = 6,439 YTD = $16MM
Large Consumer Business – Europe • Annual Energy Spend >$10MM • High Packaging • National Footprint • Enron Sales Force • Dedicated Service Manager YTD Results $21.7 4 1 $20.4 3 0 $0 $1.3 00 01 00 01 Transactions Gross Margin (Millions) Manufacturing Commercial
Transactions Gross Margin(Millions) Small Consumer Business – Europe • Annual Energy Spend <$10MM • Highly Standardized • Regional • Commissioned Sales Force • Call Center Support YTD Results Channels $90.1 228,380 228,420 $87.9 $71.9 130,153 $87.5 40 228,000 $2.2 $71.7 130,000 .2 420 153 00 01 00 01 Direct Agent Transactions Gross Margin (Millions) Netherlands Spain UK
2001 gross margin excludes ______ closed Ontario power deals with ______ margin due to market not opening until 2002. Margin will be recorded when the market opens
Transactions Gross Margin(Millions) Small Consumer Business – Canada • Annual Energy Spend <$10MM • Highly Standardized • Regional • Commissioned Sales Force • Call Center Support YTD Results Channels $2.85 161 $2.85 161 $0.1 17 $2.75 144 0 $0 00 01 00 01 Agent Transactions Gross Margin (Millions) Ontario Alberta
Global Product Mix Q3 Q4 Power Natural Gas Tariff DSM Facility Services Construction Services
228 194 170 182 20 26 Q101 Q201 Q301 Services • Client Management • Contract Compliance • Customer Issues Management • Call Center Management • Billing • Customer Enrollment and Set-up • Ensures Customer Satisfaction • Manages Maintenance Costs Customers (000s) Customer Satisfaction 4.30 4.19 4.14 4.05 3.69 3.63 3.58 3.42 Overall Identify Solutions Follow-up Executive Support 2000 Average Q2 2001 Average EES U.S. EFS EES Europe
NPV Savings NPV Savings NPV Savings Capital Capital Capital Energy Asset Management • Products: DSM, Load Curtailment, Distributed Generation, Facility Services • Pricing, Delivery, Execution and Verification • Performance Measurement • Syndication and Sourcing EAM Project Status (Millions) EAM, Facility Services and Construction Services 305 269 264 Sq. Feet (Billions) Facilities 227 194 188 173 165 189 164 124 121 117 99 80 63 70 52 3/31/01 6/30/01 9/30/01 1999 2000 9/30/01 Square Feet (Billions) Complete In Progress Facilities
Service LINC Construction EBSI Enron Facility Services • Engineering and Construction • HVAC Operations and Maintenance • Facility Management • HVAC Service Franchising YTD Gross Margin (Millions) $69.7 $64.1 $5.9 $6.1 $10.1 $5.4 $18.3 $21.5 $35.4 $31.1 2000 2001
East Europe Risk Management • Commodity Risk Management Services • Logistics • Back-Office • Risk Analysis • Deal Capture and Validation Natural Gas Volumes – U.S. (BBTU/d) Electricity Volumes (Thousand MWh) 1,083 xxx 971 xxx xxx 905 xxx xxx xxx xxx 770 xxx xxx xxx 722 722 666 301 527 603 xxx 401 504 xxx xxx 506 xxx 2,320 2,515 2,287 2,244 2,477 364 1,204 868 Q1 Q2 Q3 Q4 Q1 Q2 Q3 Q1 Q2 Q3 Q4 Q1 Q2 Q3 2000 2001 2000 2001 West