Enron Energy Services
Enron Energy Services. Distribution. Boilers. Transmission. Chillers. Controls. Generation. Lighting. Substations. Energy Management Market. Public Utility. “Private Utility”. End Products. Energy Conversion Assets. Lighting. Conditioned Air. Power.

Enron Energy Services
E N D
Presentation Transcript
Distribution Boilers Transmission Chillers Controls Generation Lighting Substations Energy Management Market Public Utility “Private Utility” End Products Energy Conversion Assets Lighting Conditioned Air Power Market Opportunities - United States $465 Billion Market Opportunities - Europe $300 Billion $180 $70 $120 $110 $175 $110 Commodity Services: HVAC Services & Capital Services: Facility Management
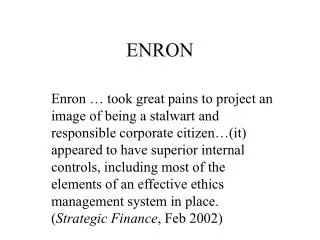
Enron Energy Services • Strong Sales and Service Execution • Fundamental Improvement in Market and Regulatory Environment Expand Opportunities • Extending Enron Energy Services Business Model to Related Markets and Products
Past Commitments Analyst Conference Excerpts From Prior Presentations 1996 Downstream Merchant “Potential for Significant Shareholder Wealth Creation” 1997 “Established Necessary Infrastructure to Lead in a Competitive End-user Energy Market” 1998 “Deregulation Created an Immediate Opportunity for Enron Energy Services to Manage Energy Needs of Companies…” 1999 “Market for Energy Outsourcing to U.S. Business Is Huge. 1999 Will Be a Breakout Year With Positive Earnings by 4th Quarter.” 2000 “2000 Will Be a Defining Year in Terms of Sales, Service Execution and Income Growth…” “$16 Billion TCV and $50 Million in IBIT.”
Enron Energy ServicesRevenues Quarterly (Millions) Annual (Billions) $10.0 $1,657 $1,476 $840 $4.6 $642 $556 $542 -8.1% $370 $340 $1.8 1999 2000 2001E Q199 Q299 Q399 Q499 Q100 Q200 Q300 Q400
Enron Energy Services IBIT Quarterly (Millions) Annual(Millions) $225 $33 $30 $103 $24 $16 $50* $7 Q199 Q299 Q399 1999 Q499 Q100 Q200 Q300 Q400 2000 2001E ($68) ($18) ($26) *Original Target ($31)
Enron Energy Services TCV Growth(Billions) $30.0 $16.1 $8.5 $3.8 $1.7 1997 1998 1999 2000 2001E TCV = Total Contract Value
North AmericaStrong Sales and Service Execution Enron Has Made Energy Outsourcing An Accepted Business Practice Transaction Flow And Efficiencies Accelerating Sales and Marketing Channel Readily Extended To Other Markets And Products
Accelerating Deal Flow(Billions of TCV) $101.5 $44.5 Senior Executive MeetingWith Customer $60.6 ConfidentialityAgreement $24.9 $26.8 Exclusive Letter of Intent $37.7 $19.4 $30.0 $18.1 $30.2 $16.1 $ 7.4 $17.6 Signed Contracts $8.5 $10.9 Contract Contract Contract Contract Contract Contract Potential Actual Potential Actual Potential Target 2001E 1999 2000 TCV = Total Contract Value
Efficiencies Are Increasing Productivity(Large Outsourcing Customers) 1997 2000 Target 2001 • Sales Cycle (Months) 12-18 9-15 5-8 • Time To Price A Deal (Weeks) 8 3 1 • Credit Approval Cycle 2 wks. 2 days 4 hrs. • Referrals Per Deal 0 4 8 • Client Meetings Per Deal 80 35 20 • People Per Deal Entire Co. 15 6 • Standardization Percentage 0% 25% 60% Increase Speed: Increase Capacity: Sales and Supporting Infrastructure Are Systematically Managed For Superior Results
Sales and Marketing Channel Extendable Current Fortune 1000 Established Sales Force Future Multiple Business Opportunities Sales Support Infrastructure Market Analysis and Targeting Channel Strategy Product and Salesforce Training Advertising and Public Relations Customer Relationship Management Market Information Modeling Standardized Components/Products Customized Components/Products Risk Management Pricing
EuropeStrong Sales and Service Execution European Market and Regulatory Environments are Similar to U.S. Immediate Success In Middle Market Outsourcing Business Has Successfully Launched
Commodity Services: HVAC Services & Capital Services: Facility Management Europe $300 Billion $70 $120 $110 European Market Opportunities Commodity Opportunities (Billions) $27 $19 $17 $16 $12 $7 $6 $6 France Italy Other Nordic Region U.K. Spain Germ. Neth.
Success In Middle MarketEnron Direct Growth - U.K. Overview Electricity Volumes (Twh) Customer Sites Headcount • Small Industrial and Commercial Customers • Direct and Third Party Sales Force • Low Overhead • Largest Non-Incumbent Retail Energy Supplier 134,000 188 11.7 Expansion • Spain • The Netherlands • Germany 51 27,000 1.7 1999 2000 1999 2000 1999 2000
Outsourcing BusinessHas Successfully Launched NORDIC6 Potential TCV = $0.6 Bn BENELUX 2 Potential TCV = $0.1 Bn …in additionPAN EUROPEAN6 Potential TCV = $2.5 Bn UK 4 Potential TCV = $0.7 Bn GERMANY8 Potential TCV = $1.4 Bn 25 Additional Prospects, TCV = $7.9B 2000 Success: 4 Contracts, $1.2 Bn TCV, 3 Countries 2001 Potential: 26 Contracts, $5.3 Bn TCV, 5+ Countries
Global Energy ServicesStrong Sales and Service Execution Executing On Service Requirements Technology Applications are Yielding Enormous Benefits Customer Satisfaction Results in Business Growth and Customer Referrals
1998 1998 1999 1999 2000 2000 1998 1999 2000 Enron Energy Services Portfolio Facilities UnderContract Square FeetUnder Contract (Billions) Value of AssetsControlled (Billions) $8.5 2.8 28,800 16,600 $4.0 11,500 1.0 $1.0 0.3
Customer and Service Portfolio State Legend > 1,000+ Customer Facilities > 100 - 1,000 Customer Facilities > 0 - 100 Customer Facilities Enron Energy Services Locations
Energy Cost (Tariff)Consumption Pattern c/Kwh Traditional Power Systems Typical Cost & Consumption Customer 24 Hour Period Traditional Tariffs Block Price Signals
Enron Value Creation Enron Building Customer Site Intellectual Capital • Monitoring Technology • Information and Expertise Used To: • Manage Energy Consumption and Supply on a Realtime Basis • Optimize Costs of Commodity, Energy Assets and Labor Collectively • Continuous Monitoring of Customer Satisfaction
c/Kwh c/Kwh Energy Cost (Market) Consumption Pattern Energy Cost (Tariff) Consumption Pattern Technology Applications YieldingEnormous Benefits Enron Energy Services Real-Time Cost & Consumption Demand Prices Enron Customer Weather 24 Hour Period Traditional Customer 24 Hour Period
Value of U.S. Peak Power Reduction Peak Load = 150 Bn Kwhs 5% of Total Peak Load Valued At $35 Billion = $240 / Mwh Valued At $140 Billion 95% of Total Off-Peak Load = Off-Peak = 3,000 Bn Kwhs Time Real Time Asset Performance Measurement Enables Enron To Capture Peak Power Value
Customer Satisfaction Results In Customer Referrals • Critical Metric to Ensure: • Customer Referrals • Contract Renewals • Value EnhancementOpportunities • Exceeded 2000 Targets • Continuing to Raise the Bar for Customer Satisfaction 4.20 4.00 Referral Threshold
Enron Energy Services • Strong Sales and Service Execution • Fundamental Improvement in Market and Regulatory Environment Expand Opportunities • Extending Enron Energy Services Business Model to Related Markets and Products
Fundamental Improvementin Market Environment Utilities Will Abandon Regulated Merchant Services, Expanding Retail Opportunities Upward Shift in Energy Prices Has Significantly Increased Demand for Enron Products and Improved Enron Value Proposition
Stranded Cost Recovery (Since 1998) • 38 Utilities Recovering Stranded Costs • $50 Billion Collected Why Re-Regulation Won’t Happen Utility Unbundling(Since 1998) Mergers / Acquisitions (Since 1996) • 54 Utilities Unbundling • $40 Billion in Generation Sold • 69 Mergers Involving Utilities • 26 Mergers Where Electric Utility Assets Changed Hands • 18 Mergers Pending
Utilities Are Facing IncreasingRisk in Merchant Role Utilities Recover Profits and Costs in the Following Way: Utility Tariff =Return on Assets + Energy Costs Purchasing Energy Below Market Yields Only Pass-Thru; NO PROFIT Purchasing Above the Market or Above Expectations(e.g. California); RISKS LOSSES Deregulation Increases the Risk Portion of the Tariff
Utilities Leaving Merchant Function States w/Competitive Default Supplier Percent of National C&I Market* # of Utilities* Current (Jan. 2001) By July 2001 By Dec. 2002 Other 5% 36% 49% 12 49 73 * Cumulative
Utilities Forced To Increase TariffsDue To High Market Prices (¢/Kwh) 24 24 Market Prices 20 Competitive Advantage 20 Tariff B 16 16 Underrecovery Surcharge for Underrecovery 12 12 Market Prices Tariff A 8 8 Estimated Fuel Costs Estimated Fuel Costs Return on Assets Return on Assets 4 4 0 0 Sept. 00 Jan. 01 Feb. 01 Oct. 01 Period 1 Period 2 Increased Tariffs and Decreasing Forward MarketPrices Will Increase Demand For Enron’s Products
Energy Price ImpactOn Companies’ Operating Expenses 2000 Commodity Prices Energy Cost as % of TotalOperating Expenses Power ($/MWh) Nat. Gas ($/mmbtu) 54% Jan.-00 Dec.-00 29% 29% 24% 11% 10% Fast Food Restaurant Hotel Mall Jan. 00 Dec. 00 With or Without Deregulation, Impact of Rising Energy CostsWill Increase Demand For Enron Products
Enron’s Value Proposition ExtendingTo More Customers Average Spend Per Company (Annual) Annual Energy Commodity Expense Average Number of Sites Segment Spend (Billions/Year) Number of Companies Fortune 100 $100,000,000+ 100 100 $120,000,000 $20,000,000+ 70 1,000 $56,000,000 $2,000,000+ 50 10,000 $3,300,000 $20,000 to $2,000,000 1.2 1,100,000 $44,000 >$20,000 1.0 7,000,000 $3,500 $12 Fortune 1,000 $56 Fortune 10,000 $33 Mass Market $49 Small Mass Market $18
Enron Energy Services • Strong Sales and Service Execution • Fundamental Improvement in Market and Regulatory Environment Expand Opportunities • Extending Enron Energy Services Business Model To Related Markets and Products
Partial List of Opportunities • Residential Energy Markets • Technology • Power Quality • Distributed Generation • Demand Side Management • Software • Insurance Products • Equipment Leasing
Residential Energy MarketsThe New Power Company • Enron Identified Huge Residential Energy Market Opportunity - $150+ Billion • Formed Company (NPW) to Pursue Opportunity • Strong Partners • Strong Management Team in Place • Raised $750 Million in Public and Private Funding • Status • Fully Funded Business Plan • Large Customer Base (Over 300,000) • Current Commodity Price Environment Favorable for NPW
Emerging Energy Technologies # Units % of “EP” Enron Has Accrued a Meaningful Customer Base Through Which to Distribute Energy Technology Solutions
Distribution Channel Will Determine Winning Technology Computer Programming(Market Share) 60% 40% Power Quality(Market Share) 20% 60% 0% 1990 1995 2000 40% Microsoft Apple VCR Technology(Market Share) 20% 80% 0% 1990 1995 2000 2005 60% 40% Technology A Technology B 20% 0% 1985 1990 1995 2000 VHS Beta
Power Quality Market DrivenBy Scale and Energy Use Lights Appliances Elevators Phones Computers HVAC Servers Controls Energy Use Examples Mission Critical % of Total Electricity Load Today 2006 65% 20% 15% 10% 10% 20% 5% 25% 5% 25% Power Quality Reliability 99.9% 99.99% 99.999% 99.9999% 99.99999%
Enron ComprehensivePower Quality Solutions • Power Quality of Grid • Reliability at Risk • Limited Power Quality • Commodity Price Volatility Customer • Today’s Available Solution • Integration Risk • Technology Risk • Commodity Price Volatility Customer Energy Information Management Commodity Management • Enron’s Bundled Solution • Business Interruption Protection • Technology Risk Management • Commodity Price Protection Equipment & Technology Capital Management Facility Management Customer
Solution DrivesMarginal Cost of “9” Current Market Solution Commodity and Asset Risk Management Capital Cost Enron’s Solutions Power Quality .9 .99 .999 .9999 .99999 Technology Developments Will Shift Cost Curve To Right Total Risk Management Will Flatten Cost Curve Across 9’s
Convergence of Broadbandand Power Quality Fuel Cell Provider Broadband Data Services $ Equipment $ Risk Management Equipment Other Customers Server/Digital Equipment Provider FiberOptic Data Center $ $ Optionality $ Enron Energy Services Will Expand Its Offering Of Power Quality Solutions In 2001 Through Partnerships With Industry Leaders
Enron Energy Services • Strong Sales and Service Execution • Fundamental Improvement in Market and Regulatory Environment Expand Opportunities • Extending Enron Energy Services Business Model to Related Markets and Products