Discovering DNA: Watson, Crick, and Franklin's Pioneering Work in Genetics
90 likes | 262 Vues
This document explores the groundbreaking contributions of James Watson, Francis Crick, and Rosalind Franklin to our understanding of DNA's structure. It highlights Franklin's X-ray diffraction photograph that revealed crucial insights into DNA's double helix formation. The text further discusses the importance of mRNA sequences in gene expression and the biochemical principles behind DNA melting temperatures and hybridization. Through historical context and scientific analysis, this piece showcases the interplay of different researchers in the field of genetics.

Discovering DNA: Watson, Crick, and Franklin's Pioneering Work in Genetics
E N D
Presentation Transcript
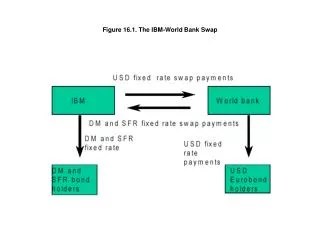
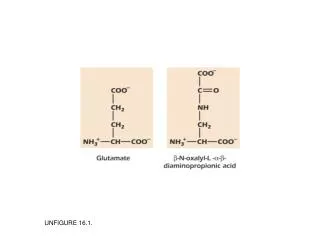
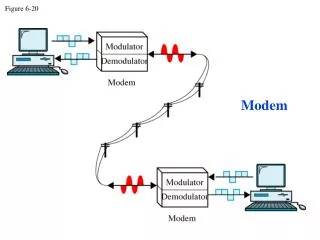
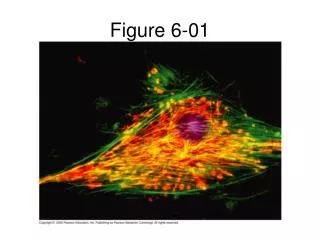
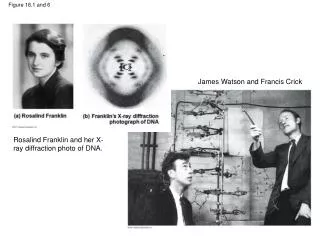
Figure 16.1 and 6 James Watson and Francis Crick Rosalind Franklin and her X-ray diffraction photo of DNA.
>gi|14456711|ref|NM_000558.3| Homo sapiens hemoglobin, alpha 1 (HBA1), mRNA ACTCTTCTGGTCCCCACAGACTCAGAGAGAACCCACCATGGTGCTGTCTCCTGCCGACAAGACCAACGTCAAGGCCGCCTGGGGTAAGGTCGGCGCGCACGCTGGCGAGTATGGTGCGGAGGCCCTGGAGAGGATGTTCCTGTCCTTCCCCACCACCAAGACCTACTTCCCGCACTTCGACCTGAGCCACGGCTCTGCCCAGGTTAAGGGCCACGGCAAGAAGGTGGCCGACGCGCTGACCAACGCCGTGGCGCACGTGGACGACATGCCCAACGCGCTGTCCGCCCTGAGCGACCTGCACGCGCACAAGCTTCGGGTGGACCCGGTCAACTTCAAGCTCCTAAGCCACTGCCTGCTGGTGACCCTGGCCGCCCACCTCCCCGCCGAGTTCACCCCTGCGGTGCACGCCTCCCTGGACAAGTTCCTGGCTTCTGTGAGCACCGTGCTGACCTCCAAATACCGTTAAGCTGGAGCCTCGGTGGCCATGCTTCTTGCCCCTTGGGCCTCCCCCCAGCCCCTCCTCCCCTTCCTGCACCCGTACCCCCGTGGTCTTTGAATAA AGTCTGAGTGGGCGGC LE 16-5 http://www.ncbi.nlm.nih.gov/
(a) Space-fillingmodel Key features ofDNA structure (c) 5 end G C Hydrogen bond C G 3 end C G C A T G 3.4 nm Figure 16.7 A T C G C G C G A T 1 nm G C T A C G C G T A G C 3 end A T A T 0.34 nm 5 end A T (b) Partial chemical structure
Sugar Figure 16.8 Sugar Adenine (A) Thymine (T) Sugar Sugar Guanine (G) Cytosine (C)
Purine purine: too wide Figure 16.UN01 Pyrimidine pyrimidine: too narrow Purine pyrimidine: widthconsistent with X-ray data
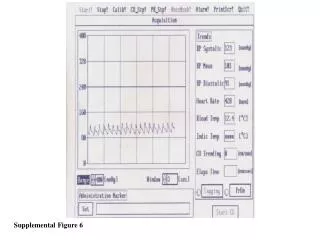
Stability of DNA: example of a DNA melting curve. UV absorbance spectra of native and heat-denatured E. coli DNA. Voet, Fundamentals, 2nd
Variation of the melting temperatures, Tm, of various DNAs with their G + C content. Relevance for DNA melting and hybridization PCR (polymerase chain reaction) DNA microarrays (gene expression) Helicases, polymerases (transcription, duplication) Chargaff’s rule shows correlation between Tm and G+C content Voet and Voet, Biochemistry, chapter 5