Download
1 / 1
10 likes | 123 Vues
Investigating the declining trend of Arctic sea ice cover since 1978 and the unprecedented extreme minimum years of 2002, 2003, and 2004. The impact of Arctic Oscillation on sea ice dynamics and the potential critical threshold of the sea ice system are analyzed.

E N D
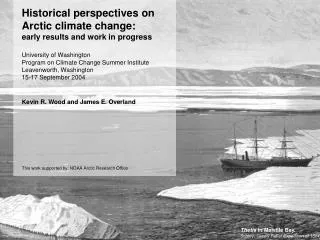
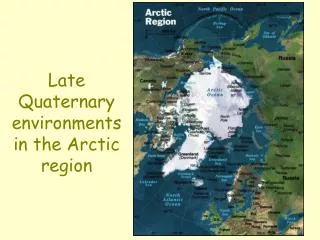
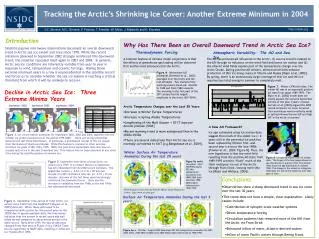
Tracking the Arctic’s Shrinking Ice Cover: Another Extreme Minimum in 2004 http://nsidc.org J.C. Stroeve, M.C. Serreze, F. Fetterer, T. Arbetter, W. Meier, J. Maslanik and K. Knowles Introduction Why Has There Been an Overall Downward Trend in Arctic Sea Ice? Satellite passive microwave observations document an overall downward trend in Arctic sea ice extent and area since 1978. While the record minimum observed in September 2002 strongly reinforced this downward trend, the situation repeated itself again in 2003 and 2004. In general, Arctic sea ice conditions are inherently variable from year to year in response to wind, temperature and oceanic forcings. Having three extreme minimum years in a row is unprecedented in the satellite record and forces us to consider whether the sea ice system is reaching a critical threshold from which it will be unlikely to recover. Thermodynamic Forcing Atmospheric Variability: The AO and Sea Ice A common feature of climate model projections is that the effects of greenhouse gas loading will be observed first and be most pronounced in the Arctic. The AO has pronounced influences in the Arctic: (1) sea ice trend is related to the AO through its influence on the wind field and hence ice motion and (2) the altered wind fields explain part of the temperature change over the Arctic Ocean. During positive AO winters, altered wind fields enhance production of thin ice along coasts of Siberia and Alaska [Rigor et al.,2002]. By spring, there is an anomalously large coverage of thin ice and this ice requires less total energy in summer to completely melt. Figure 4.Wintertime SAT anomalies [Semenov et al., 2003] averaged over the Arctic and the mid-latitudes. Two characteristic warming events stand out: mid 20s to 1940 and from 1980 onwards. The warming in the first part of the 20th century had its largest amplitude in the Arctic (60o-90oN). Figure 7. Winter (JFM) AO Index. The winter AO was in an especially positive AO state from about 1989-1995. The Rigor et al. [2002] model does not neatly explain the extreme September minima of the past 3 years. Instead, Serreze et al. [2003] argued the 2002 record minimum ice cover occurred from anomalous warm southerly winds in spring followed by low SLP and high SAT in the Arctic in summer. Decline in Arctic Sea Ice: Three Extreme Minima Years September 2002 September 2003 September 2004 • Arctic Temperature Changes over the Last 35 Years • Increase in Winter Europe Temperatures • Increase in Spring Alaska Temperatures • Lengthening of the Melt Season -> 10-17 days per decade [Comiso, 2003] • Recent warming trend is more widespread than in the 1920s-1930s. • There are several indications that Arctic sea ice is inversely correlated to SAT [e.g.Bengstsson et al., 2004]. A New AO Framework? Ice age estimated using ice motion data suggest that much of the oldest ice (> 4 years old) in the perennial ice pack has been replaced by thinner first- and second-year ice since the late 1980s [Fowler et al., 2004; Figure 8]. Thus, the new hypothesis is that the wind field resulting from the positive AO state from 1989-1995 acted to “flush” much of the thick multiyear ice out of the Arctic through Fram Strait, leaving more thin ice [Rigor and Wallace, 2004]. Figure 1.Ice concentration anomalies for September 2002, 2003 and 2004, together with the median ice extent calculated over the period 1979-2000. There are strong similarities between the last three Septembers. In particular, a pronounced retreat of the ice margin from the shores of Siberia and Alaska. While this feature is common to other extreme minimum ice years (1990, 1993, 1995, 1998), the past three Septembers have also seen an unusual lack of ice in the east Greenland Sea. This feature has not been observed at any other time during the satellite passive microwave era. Winter Surface Air Temperature Anomalies During the last 20 years Figure 8. Ice age estimated from ice motion data. The larger of the two images shows ice age distribution in autumn 1996. The smaller inset shows ice age distribution in autumn 1988. The change in the oldest ice categories illustrates the loss of the oldest ice over that span of time. Figure 2.September time-series of total Arctic ice extent since 1979. It is evident that ice in September has not rebounded from the 2002 record minimum. The September trend is (- 0.54 + 0.113) x 106 km2 per decade at a 99% confidence interval, (or -7.7% + 3% per decade). Inclusion of the last three years has strongly reinforced the downward trend. Note also the increase in variability from the 1980s to the mid 1990s has subsequently decreased. Figure 5a and b.November – April NCEP Reanalysis925 hPa temperature anomalies from 1980-1989 (left) and from 1990-2000 (right) referenced to 1968-1996. • Conclusions • Observations show a steep downward trend in sea ice cover over the last 30 years. • This trend does not have a simple, clear explanation. Likely causes include: • Contribution of synoptic-scale weather systems • Direct temperature forcing • Circulation patterns that removed more of the MYI from the Arctic via Fram Strait • Enhanced inflow of warm, Atlantic-derived waters • Inflow of warm Pacific waters through Bering Strait. NCEP Reanalysis data from the NOAA/CIRES Climate Diagnostics Center - http://www.cdc.noaa.gov/ Surface Air Temperature Anomalies During the last 3 years Figure 3. September time-series of total Arctic ice extent since 1901 from the HadISST1 [Rayner et al., 2003] data set. While these data need to be interpreted with caution for the period prior to the 1950s due to sparse available data, the time series indicates that the extent in recent years was well below normal compared to any previous period in the data record. Note after 1996 the source data was changed from that used in Figure 2 (e.g. NASA Team sea ice algorithm) to NCEP data, resulting in different ice trends after 1996. Figure 6a-c.October – August NCEP Reanalysis 925 hPa temperature anomalies for 2001-2002 (left), 2002-2003 (middle) and 2003-2004 (right) referenced to 1968-1996.