Download
1 / 21
260 likes | 431 Vues
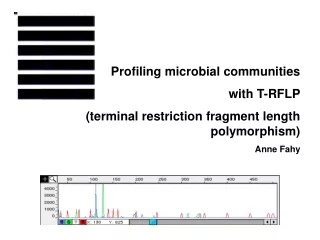
Profiling microbial communities with T-RFLP (terminal restriction fragment length polymorphism) Anne Fahy. why microbial ecology?.

E N D
Profiling microbial communities with T-RFLP (terminal restriction fragment length polymorphism) Anne Fahy
why microbial ecology? Microbial organisms occupy a peculiar place in the human view of life. Microbes receive little attention in our general texts of biology. They are largely ignored by most professional biologists and are virtually unknown to the public except in the context of disease and rot. Yet, the workings of the biosphere depend absolutely on the activities of the microbial world. (Pace, 1997) • huge metabolic diversity • “higher” organisms dependent on microbial activities • applications: bioremediation and natural attenuation of pollutants in the environment
why culture-independent? • between 0.001 and 1 % microorganisms are culturable (Amann 1995) • microbial communities are complex: huge diversity close interactions between organisms highly dynamic phylogenetic tree based on 16S rRNA : major phyla of the domain Bacteria (Rappé & Giovannoni, 2003) black = 12 original phyla described by Woese, 1987 white = 14 phyla with isolated representatives grey = 26 candidate phyla with no known isolates
why 16S rRNA as a phylogenetic marker ? • protein translation : universal • no horizontal transfer (caveat: Wang & Zhang, 2000) • convenient length : 1500 bp • highly conserved regions as well as species-specific regions • large databases (EMBL, NCBI, DDJB) secondary structure of the Escherichia coli 16S rRNA molecule (Van de Peer, et al. 1996). colours variability between organisms: pink = highly conserved red = least conserved grey = unaligned
other phylogenetic markers • proteins; difficult to identify homologous proteins (Demoulin, 1979) • historically: also 5S, 23S rRNA • ribosomal intergenic spacer: 16S – 23s • 18S for Eukaryotes
T-RFLP (Terminal Restriction Fragment Length Polymorphism) 1extraction of community DNA or RNA from environmental sample (need RT-PCR step with RNA) 3 digestion of amplicons with restriction enzyme 2PCR amplification of 16S rRNA gene with fluorescent primers 4 detection and sizing of labelled terminal fragments by capillary or gelelectrophoresis
raw data T-RFLP (2) Red: internal size standard Blue:forward primer Green:reverse primer
T-RFLP (3) Analysis of raw data with Genescan: virtual filter: adjust overlap of fluorescence sizing: standard curve integration of peaks size calling curve
T-RF length in nucleotides relative peak height T-RFLP (4) Electropherogram: a visual profile of the community. In principle, the height and area of the peaks are representative of the abundance of the groups of organisms. Several groups of organisms may share the same T-RF. Table: digital data can be further processed and used, for example, to generate dendrograms illustrating the relationship between bacterial communities.
T-RFLP : resolution • several groups of organisms may share the same T-RF • T-RFs need to be within range of size standard resolution of T-RFLP depends on the choice of restriction enzyme / primer combination • Ribosome Database Project: • TAP-TRFLP application • enter choice of enzyme/primer • in silico digestion of 16S rRNA on the database • http://rdp8.cme.msu.edu/html/TAP-trflp.html#program several digests + combine data increase resolution
Rs + PO4 Rhodoferax antarcticus ( Proteobacteria, Comamonadaceae) T-RFLP : good technique • reproducible technique • relatively fast monitor community dynamics • culture-independent • digital data for further analyses • link data to clone libraries
but….. …. need to look at data to avoid pitfalls and know the limitations • sources of biases (von Wintzingerode et al., 1997): • experimental design • sampling • storage of sample • DNA extraction • PCR amplification (loads of literature!) keep experimental procedures constant PCR-based techniques provide information that is not obtainable through other methods
clone M232: 3 hours digestion clone M232: 15 hoursdigestion limitations inherent to T-RFLP • glitches in the electrophoresis rerun sample • incomplete digestion (partially single-stranded amplicons; Egert & Friedrich, 2003) be aware
limitations inherent to T-RFLP (2) renaturation of sample: salts in buffer amount of DNA in sample delay between denaturation and electrophoresis rerun sample renaturation of internal size standard
12 seconds injection d d 6 seconds injection 3 seconds injection limitations inherent to T-RFLP (3) overloading of the capillary rerun sample
limitations inherent to T-RFLP (4) sizing problems discrepancy between: expected T-RF (from in silico digestion of known sequence) apparent T-RF (from electrophoresis) caution when interpreting T-RFLP profiles
limitations inherent to T-RFLP (5) sizing problems causes: - apparent size varies with the type of genetic analyser: a 142 nt fragment will measure 143.4 and 140.6 nt respectively on a gel or capillary genetic analyser (GeneScan Reference Guide) - resolution: decreases as fragment length increases - ROX label of internal standard migrates more slowly than the FAM label of the forward primer (Boorman et al., 2002) - apparent size of fragment depends on its secondary structure
limitations inherent to T-RFLP (6) sizing problems - difference ± proportional to fragment length - can vary from -2 to -4 nt for very similar length of fragment - outside range of size standard: can’t size accurately - abnormal migration
limitations inherent to T-RFLP (7) sizing problems very abnormal migration from a specific clone T-RF: • possible “hairpin” from secondary structure • - no such discrepancy from other clones with same sequence immediately preceding the restriction site in press: Nogales et al. (a study of mobility anomalies of 16S rRNA gene fragments)
limitations inherent to T-RFLP (8) Conclusions: T-RFLP very reproducible (electropherograms need to be perfect) comparison of data limited to studies using same type of genetic analyser cannot predict phylogenetic affiliations from the length of the T-RFs within its limitations, T-RFLP is a good culture-independent technique for profiling microbial communities!
many community profiling techniques • Techniques based on PCR of rDNA • Cloning and sequencing of 16S rDNA • DGGE (denaturing gradient gel electrophoresis) • SSCP (single strand conformation polymorphism) • RFLP (restriction fragment length polymorphism) • LH-PCR (length heterogeneity analysis by PCR) • ARISA (automated ribosomal intergenic spacer analysis) • DGGE and T-RFLP also used for diversity of catabolic genes • Other approaches to community profiling • Hybridisation, FISH, PLFA, BIOLOG • Linking metabolic function to phylogeny • SIP (stable isotope probing)