Download
1 / 27
300 likes | 1.1k Vues
Chapter 6 The Risk and Term Structure of Interest Rates. Terezia Chen Jody Giesbrecht. Overview. Web Exercises Risk Structure of Interest Rates Default risk Liquidity Tax Considerations Term Structure of Interest Rates Yield Curves

E N D
Chapter 6The Risk and Term Structure of Interest Rates Terezia Chen Jody Giesbrecht
Overview • Web Exercises • Risk Structure of Interest Rates • Default risk • Liquidity • Tax Considerations • Term Structure of Interest Rates • Yield Curves • Expectations Theory, Segmented Markets Theory, Liquidity Premium Theory, Preferred Habitat Theory
Web Exercises • 1. What has the average rate of inflation been since 1995? What year had the highest and lowest levels of inflation? • Average rate of inflation: 2.04% • Highest rate: 4.70% in Feb 2003 • Lowest rate: 0.60% in Jan 1995 From www.bankofcanada.ca/en/cpi/htm
Web Exercises • 2. What is the cost today of a car that cost $10,000 the year that you were born? • 1914 - $189,830.51 – avg inflation rate of 3.22% • 1950 - $90,322.58 – avg inflation rate of 3.94% • 1975 - $38,356.16 – avg inflation rate of 4.29% From www.bankofcanada.ca/en/inflation_calc.htm
Web Exercises • 3. What happens to the difference between the adjusted value of an investment compared to its inflation-adjusted value as: • Inflation increases (3 to 5%)? • Buying Power: 3% - $8626.09 5% - $7835.26 • The investment horizon lengthens (5 to 10 years)? • Buying Power: 5yrs - $8626.09 10 yrs - $7440.94 • Expected returns increase (5 to 8%)? • Buying Power: 5% - $12120.51 8% - $16064.43 From www.moneychimp.com/articles/econ/inflation_calculator.htm
Risk vs. Term • Relationships among interest rates can be defined by two aspects: • Risk structure of interest rates – relationship among the different interest rates on bonds with the same term to maturity • Term structure of interest rates – relationship among interest rates on bonds with different terms to maturity but with same default risk
Risk Structure of Interest Rates • Default Risk • Occurs when issuer of a bond is unable or unwilling to make interest payments or repay principle when bond reaches maturity • Default-free bonds – no default risk – Canadian Government Bonds • Risk Premium – spread between the interest rate on a risky bond and a default-free bond
Default Risk Information • Credit-Rating Agencies – investment advisory firms that rate quality of bonds in terms of probability of default • Agencies used in Canada: Standards & Poors, Moody’s Investors Service, Fitch Ratings • Junk Bonds • Fallen Angels
“The Junk Bond King” • Michael Milken • Executive at Drexel Burnham Lambert Inc during 1980’s • used high-yield junk bonds for corporate financing and mergers and acquisitions
Bond Defaults in Canada • CBC article published Sept. 2003 • Rate of default lower in Canada than US • Canada: 1.9% US: 2.4% • Recovery rates for Canadian bonds lower than in the US • Canada: 30% of par US: 42% of par From http://www.cbc.ca/money/story/2003/09/10/moodys_030910.html
Can Lack of Bond Defaults Last Forever? • Article from the Financial Post by David Berman – June 2007 • Default rate hit zero in 2006 • More bond upgrades than downgrades • What does this signal for the future? • Possible increase in speculative grade bonds • Higher borrowing costs • Decrease in corporate profit growth From http://www.canada.com/nationalpost/financialpost/story.html?id=045d7cbd-3cc2-4591-abdf-8056956ef88b
Risk Structure of Interest Rates • Liquidity • Ease with which a bond can be traded or sold • Canada bonds considered most liquid • If corporate bonds are traded less widely, liquidity and demand will decrease. This will cause the price of the bond to fall and, conversely, the interest rate to rise As the price falls from P1 to P2, the interest rate will move upwards
Risk Structure of Interest Rates • Income Tax Considerations • In some countries, certain government bonds are not taxable (ex: US municipal bonds) • This might allow for a greater returns than a taxable corporate bond with a higher stated return http://moneycentral.msn.com/content/Investing/Simplestrategies/P38652.asp
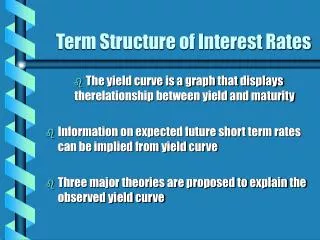
Term Structure of Interest Rates • Yield Curve – depiction of yields on bonds when risk, liquidity and tax considerations are equal but the terms to maturity differ
Term Structure Theories • Expectations Theory • Segmented Markets Theory • Liquidity Premium Theory • Preferred Habitat Theory
Purpose of Theories • To explain why yield curves take on their specific shapes • To explain 3 empirical facts: • Interest rates on bonds of different maturities move together over time • When ST rates are low, yield curves are likely to be upward sloping; when ST rates are high, yield curves are likely to be inverted • Yield curves almost always slope upward
Expectations Theory • The interest rate on a long-term bond will equal an average of short-term interest rates that are expected to occur over the life of the long-term bond • Assumption: bondholders do not prefer one maturity over another but will hold bonds with highest expected returns (perfect substitutes) • Int=(it + it+1 + … + it+(n-1))/n
Segmented Markets Theory • Markets for different maturity bonds are completely separate and therefore the interest rate of each bond with a different maturity is determined by supply and demand for that bond • Assumption: bonds of different maturities are not substitutes, so expected return of one bond has no effect on demand for a bond with a different maturity
Liquidity Premium Theory • The interest rate on a long-term bond will equal an average of short-term rates expected to occur over the life of the bond, plus a liquidity premium • Assumption: bonds of different maturities are substitutes but not perfect substitutes (investors may prefer on maturity over another)
Preferred Habitat Theory • Investors will buy bonds that do not have their preferred maturity only if they earn a higher return. • Assumption: investors have a preference for bonds of one maturity over another in which they prefer to invest
Using the Yield Curve • Often unreliable as liquidity premiums may not be accurate • Slope of yield curve does not always help to predict future short-term interest rates • Useful for very short-term and long-term but lacks reliability for intermediate term
Impact of Inverted Yield Curves • Article by Jim McWhinney - Feb 16, 2006 • Occurs when short term rates exceed long term rates • Historical indicator of recession • Consideration of supply and demand • Impact on investors and consumers
Oil Prices & their Impact • Overall Global Economy • Inflation • Interest Rates
Summary • Looked at two influences on the interest rate of a bond: • Risk • Term to Maturity • Rational Investors will select portfolios to meet desired returns based on differing amounts of risk and varying terms to maturity