Download
1 / 7
70 likes | 192 Vues
Explore oceanographic and meteorological data from equatorial Pacific buoys in a spatio-temporal visualization project, utilizing grids, color representation, arrows, legend, and animation.

E N D
Visualization of El Nino Data CS525D Project Zaixian Xie
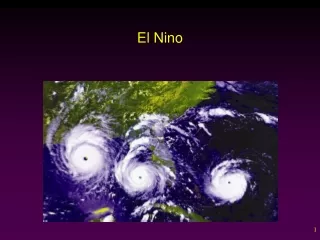
El Nino Data • Source: UCI KDD Archive http://kdd.ics.uci.edu/databases/el_nino/el_nino.html • Type: Spatio-Temporal Data • Content: oceanographic and surface meteorological readings taken from a series of buoys positioned throughout the equatorial Pacific.
El Nino Data (cont.) • We used a small subset • The data for 23 May 98 to 4 June 98 • Attributes: • buoy ID • day • latitude • longitude • winds • humidity • air temperature • sea surface temperature
Main Features • Grid and labels • Employing color to represent scalar values • Employing arrows to represent vector values • Legend • Animation • Visualizing missing values
Future Improvements • Grid On/Off • Label On/Off • Customizing color sequence, animation frequency, point size, glyph shape, arrow unit length • Integrating multiple attributes in a single figure. • 3D