Download
1 / 24
240 likes | 466 Vues
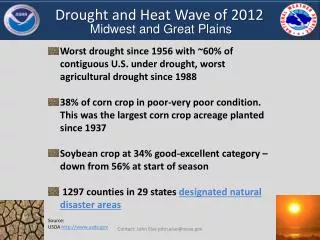
Drought and Heat Wave of 2012. Midwest and Great Plains. Worst drought since 1956 with ~60% of contiguous U.S. under drought, worst agricultural drought since 1988 38% of corn crop in poor-very poor condition. This was the largest corn crop acreage planted since 1937

E N D
Drought and Heat Wave of 2012 Midwest and Great Plains • Worst drought since 1956 with ~60% of contiguous U.S. under drought, worst agricultural drought since 1988 • 38% of corn crop in poor-very poor condition. This was the largest corn crop acreage planted since 1937 • Soybean crop at 34% good-excellent category – down from 56% at start of season • 1297 counties in 29 states designated natural disaster areas • Source: • USDA http://www.usda.gov 1063 Records Tied or Broken 464 Records of 100+ 55 All Time Records Contact: John Eise john.eise@noaa.gov
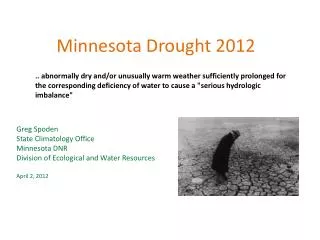
Drought Latest Conditions • Exceptional to Severe Drought across parts of Wyoming, Colorado, Kansas, Missouri, Illinois and Indiana • Areas outside of dry conditions are parts of North Dakota, Minnesota , Wisconsin and Michigan • Updated Weekly on Thursday • Source: • U.S. Drought Mitigation Center • http://www.droughtmonitor.unl.edu/
Drought Outlook thru October • Drought to persist or intensify across Central Region • Only areas to remain outside of drought are parts of west North Dakota, east Minnesota , north Wisconsin, north Michigan, and east Kentucky • Next update on July 26th • Source: • National Climatic Data Center • http://www.ncdc.noaa.gov/sotc/
6-inch Topsoil Moisture Short-Very Short vs. 5-yr Mean • < ~10% topsoil moisture left in South Dakota, Nebraska, Iowa, Kansas, Missouri, Illinois, Indiana and Michigan • All of Central Region is less than half of normal topsoil moisture. • Source: • National Climatic Data Center • http://www.ncdc.noaa.gov/sotc/ Contact: John Eise john.eise@noaa.gov
Corn and Drought • 78% of corn grown in the U.S. is experiencing drought • Almost all corn is grown within Central Region • Source: • U..S. Dept. of Agriculture • http://blogs.usda.gov/
Precipitation – Change from Normal Last Three Months (%) Source: High Plains Regional Climate Center http://www.hprcc.unl.edu/
Precipitation – Change from Normal Last Three Months (%) Source: High Plains Regional Climate Center http://www.hprcc.unl.edu/ Contact: John Eise john.eise@noaa.gov
Drought Breaker How Much Rainfall Needed? • 9-15 inches of rain needed to end drought across many areas of Central Region • Rest of Central Region would need 3-9 inches of rain • Updated weekly • Source: • NWS Climate Prediction Center • http://www.cpc.ncep.noaa.gov/ Contact: John Eise john.eise@noaa.gov
Stream Flow Conditions • Low flow conditions developing across Central Region • Worst hit states are Illinois, Indiana, Iowa, Missouri, Kansas, Colorado, Wyoming, Nebraska, Wisconsin and Michigan • Source: • U.S. Geological Survey • http://waterdata.usgs.gov/usa/nwis/rt/
Drought Links • National Drought Mitigation Center http://drought.unl.edu/ • National Drought Monitor http://droughtmonitor.unl.edu/ • National Weather Service Climate Prediction Center http://www.cpc.noaa.gov • Drought Outlook http://www.cpc.ncep.noaa.gov/products/expert_assessment/season_drought.gif • U.S. Department of Agriculture http://www.usda.gov/ • Weekly Crop Report • http://www.usda.gov/oce/weather/pubs/Weekly/Wwcb/wwcb.pdf • U. S. Drought Portal http://www.drought.gov/
8-14 Day Outlook Temperature • Warmer than normal temperatures across Central Region through the end of July • Source: • NWS Climate Prediction Center • http://www.cpc.ncep.noaa.gov/
8-14 Day Outlook Precipitation • Below normal precipitation for Central Region except for the West and North • Summer monsoon season underway with improving moisture across Colorado • Typical summer storm track will keep higher precipitation across the north • Source: • NWS Climate Prediction Center • http://www.cpc.ncep.noaa.gov/
3-Month Outlook Temperature • Probabilities lean towards warmer than normal temperatures across Central Region through September • Source: • NWS Climate Prediction Center • http://www.cpc.ncep.noaa.gov/
3-Month Outlook Precipitation • Equal chances of above, near, or below normal precipitation through September. • Source: • NWS Climate Prediction Center • http://www.cpc.ncep.noaa.gov/ Contact: John Eise john.eise@noaa.gov
Record Heat Climate Statistics
July 2012 Records Nationwide 1063 Records Tied or Broken 464 Records of 100+ 55 All Time Records Source: National Climatic Data Center http://www.ncdc.noaa.gov/extremes/records/
Record Daily High Temperatures Nationwide - July 2012 Contact: John Eise john.eise@noaa.gov
All Time Record High Temperatures Nationwide - July 2012 1063 Records Tied or Broken 464 Records of 100+ 55 All Time Records Contact: John Eise john.eise@noaa.gov
June 2012 Summary Nationwide Records Set in June 2012 1063 Records Tied or Broken 464 Records of 100+ 55 All Time Records
Historical Temperature Ranking By State for 118 Years – June 2012 • Hottest Month on Record in Colorado • Top 10% for Wyoming, South Dakota, Nebraska and Kansas • Source: • National Climatic Data Center • http://www.ncdc.noaa.gov/sotc/ Contact: John Eise john.eise@noaa.gov
Historical Precipitation Ranking By State for 118 Years – June 2012 • All Time Record Dry June in Wyoming • 2nd Driest June in Colorado • Top 1% Driest June for Nebraska, Missouri, Illinois, Indiana and Kentucky • Source: • National Climatic Data Center • http://www.ncdc.noaa.gov/sotc/
Record Daily High Temperatures Nationwide - June 2012
All Time Daily High Temperatures Nationwide - June 2012 Update: July 5, 2012