Heatwaves, Drought, and Dust: Impact on Health and Climate
490 likes | 644 Vues
Explore the deadly effects of heatwaves, the risks of drought, and the interplay of climate change. Learn about heat disorders, high temperature tolerance, and the implications of aridity. Discover how extreme events like wildfires in Europe and the 2003 drought in the Prairies impact ecosystems and communities.

Heatwaves, Drought, and Dust: Impact on Health and Climate
E N D
Presentation Transcript
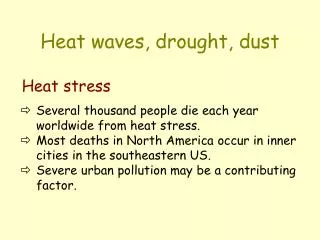
Heat waves, drought, dust Heat stress • Several thousand people die each year worldwide from heat stress. • Most deaths in North America occur in inner cities in the southeastern US. • Severe urban pollution may be a contributing factor.
Heat waves and heat disorders At temperatures above the body’s core temperature (37°C) heat must be dissipated. ~90% of heat loss occurs through skin; sweating becomes less effective at high RH (hence the increase in “apparent temperature”. If heat gain exceeds heat loss, body core temperature rises, and heat disorders occur. Sunburn can retard the body’s ability to shed heat, and may increase the severity of the heat disorder.
Human tolerance of high temperatures Heat Index chart: apparent temperature Data: NASA Relative humidity (%) 40 45 50 55 60 65 70 75 80 85 90 95 100 extreme danger danger Air temperature (°C) core
Heat disorders and apparent temperature >50°C: heatstroke/sunstroke highly likely with continued exposure 40-50°: sunstroke, heat cramps likely, and heatstroke possible with prolonged exposure and/or physical activity 35-39°: sunstroke, heat cramps and heatstroke possible with prolonged exposure and/or physical activity 30-34°: fatigue possible with prolonged exposure and/or physical activity NB: heat disorders increase with age - individual @ :20yr - heat cramps; 40yr - heat exhaustion; >60yr - heat stroke
Heat mortality Three times as many people die on extremely hot days as on normal summer days
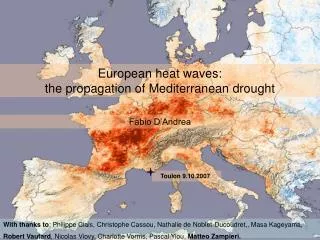
Heat wave in Europe, summer 2003 Heat Load extreme strong moderate slight comfortable Heat load, Aug. 8, 2003 @ 1300h
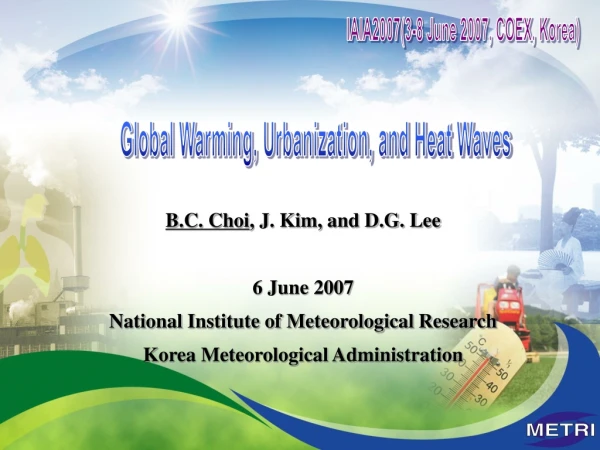
Heat waves and climate change • In the summer of 2003 Germany recorded mean temperatures >3°C above the mean for the period 1961-1990; • Was this just a 1 in 500 year extreme event? • Or was it a foretaste of the “x2 CO2” summers of the mid-21st century?
Predicted winter and summer temperature changes (°C) in California -Nevada, for AD 2070-2099 compared to AD 1961-1990 GCM: PCM Hadley PCM Hadley +10 +5 0 summer winter (JJA) (DJF) Source: Hayhoe et al. (2004) PNAS, 101, 12422–12427 +10 +5 0 CO2 by AD 2100: ~550 ppm ~970 ppm
Predicted heat-wave days in California* *Predictions based on the Hadley GCM Source: Hayhoe et al. (2004) PNAS, 101, 12422–12427
Heat waves, drought and wildfires frequently co-occur wildfires, Portugal, 2003 dessicated sunflowers, France, 2003 Photos: Munich Re, 2004
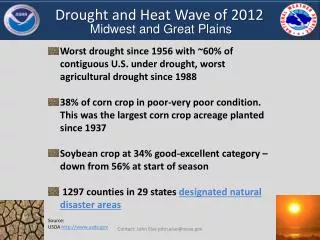
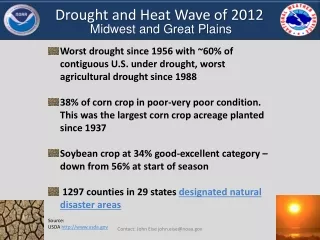
Drought: “a protracted period of deficient precipitation resulting in extensive damage to crops, resulting in loss of yield” • Hazard profile: • slow onset • prolonged duration • widespread
Drought and aridity The social and economic costs of drought are greatest in climates close to the margins of agricultural or pastoral production (e.g. in subhumid areas* rather than hyperarid or perhumid areas)
Aridity Index: = P/PET [UNEP, 1992] and drought risk AI 0.05 0.20 0.50 0.65 hyperarid arid semi-arid dry subhumid humid…………..perhumid 8% 12% 18% 10 % 52%
Drought: some early operational definitions • Great Britain (1936): 15 consecutive days with daily precipitation totals of less than .25 mm • United States (1942): less than 2.5 mm of rainfall in 48 hours • India (1960): actual seasonal rainfall deficient by more than twice the mean deviation • Bali (1964): a period of six days without rain • Libya (1964): annual rainfall less than 180 mm Note: locally-specific criteria
Drought indices • Standardized Precipitation Index(a probabilistic index based on rainfall amount compared to normals for the same period) • Palmer Drought Severity Index(based principally on antecedent rainfall and temperature) • Palmer Crop Moisture Index (based on measured soil moisture vs. normal amount)
Drought - damages Direct • loss of income • social dislocation • famine/malnutrition/deathIndirect • loss of rural and urban revenues • fire hazard, loss of water access
Drought climatology • Temperate climates - influence of blocking highs in zone of westerlies • Seasonal tropical climates - influence of ITCZ position on monsoon penetration • Humid tropical climates - influence of El Niño - Southern Oscillation
Storm tracks, blocking highs and drought in the Canadian Prairies zonal flow: no drought drought in Manitoba drought throughout drought in Alberta
Aridity Index: Canadian prairie provinces Sask. Manitoba Alberta Winnipeg Medicine Hat
AD 2001 The 2000-2002 drought in the Prairie provinces Annual precipitation AD 2002
Consequences of the 2000 - 2002 drought • “the persistent dryness, coupled with record high temperatures and grasshopper infestations, means many farmers will be bowing out of the 2002 crop season early” Edmonton Journal, July 26, 2002 • Alberta provincial government announces $324 M in drought aid; Saskatchewan to follow Alberta’s lead; • Farmers sell off beef herds, accused of dumping beef in BC; • Federal government arranges to pay for hay shipments from Ontario, then stops shipment because of potential cereal beetle infestation. Drought loss of farm income
DUST BOWL Precursors • x10 increase in population in OK,TX,AK from 1860 - 1920. • Deep ploughing and wheat monoculture destroyed soil structure and increased soil erosion potential Drought (1931-1940) • world economic slump in 1930’s; virtually no federal funds for prairie farmers • economic disaster - outmigration of “Okies”
Grapes of Wrath “And then the dispossessed were drawn west - from Kansas, Oklahoma, Texas, New Mexico: from Nevada and Arkansas, families, tribes, dusted out, tractored out. Car-loads, caravans, homeless and hungry, . . . they streamed over the mountains, hungry and restless . . . Scurrying to find work to do, . . Anything, any burden for food. The kids are hungry. We got no place to live. Like ants scurrying for work, for food, and most of all for land” John Steinbeck (1939) Drought loss of farm income social dislocation
Were the 1930’s as bad as it gets? Drought incidence, Medicine Hat, Alberta (AD1900-1996) Sauchyn et al., 2002, Géographie physique et Quaternaire 56, 247-259.
The Dust Bowl:exacerbating factors • overgrazing • cropping of marginal soils • soil erosion ------------------------------------------- Drought effects may also be magnified in areas of political strife and severe wildfires
Prairie climate: reconstruction from tree ring analysis wet Lodgepole pine:Medicine Hat, AB dry Sauchyn et al., 2002, Géographie physique et Quaternaire 56, 247-259.
Prairie climate: reconstruction from analysis of lake sediments P PET diatoms saline , Alberta fresh
Future desertification? Canadian GCM ? Aridity index: 2000 ? Sauchyn et al., 2002, Géographie physique et Quaternaire 56, 247-259. UK GCM
Drought in monsoon climates:the Sahel Inter-Tropical Front /Inter-Tropical Convergence Zone Population density (orange >25 people km-2) Source: www.mapjourney.com/sahel/
1984 1998 Drought in monsoon climates:the Sahel 20°N Vegetation (max.) Rainfall 500 km
Northward penetration of the monsoon, West Africa (1951-1973)
Hypotheses to explain Sahelian drought “Climatological” - northward penetration of ITCZ controlled by variations in atmospheric temperature in northern tropics, due to: 1. SST anomalies in northeastern Atlantic linked to general circulation (especially El Niño/La Niña), or 2. Industrial pollution (particularly SO2 aerosols) from N.America, Europe and Asia (intense drought of 1970-85). “Anthropogenic” - changes in vegetation and surface albedo caused by varying land-use result in changes in regional climate. All of these may be influenced by global warming
Rapp’s albedo feedback model rainfall vegetation grazers
SAHEL Drought • 5M people affected; >200K died from malnutrition and associated diseases • Livestock herds decimated (80% died) • Loss of livestock * loss of wealth *massive social dislocation and emigration to urban areas
ENSO and drought in western Pacific(Indonesia and N. Australia)
Rainfall relative to historical records July, 1997(El Niño)July, 1998 (La Niña)
Effects of 1997-98 drought in Indonesia Agricultural production: 20 - 30% reduction of rice crop in eastern Indonesia (parts of Kalimantan, Sulawesi and Irian Jaya. Markedly lower yam production in Irian Jaya. In some villages in the latter 20-30% of people died from malnutrition; 95% incidence of malaria reported. Conditions not as severe in western Indonesia (e.g. rice production only dropped 6% in Sumatra)
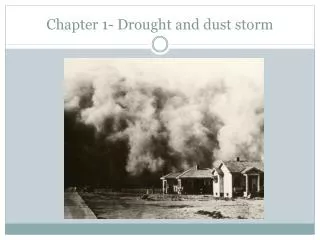
Dust storm during the 1930’s drought in the southern Great Plains
Event lasted 16 h max conc. >800 µg m-3 October 23, 2002 dust storm (Brisbane, QLD) Chan et al., 2005. Water, Air, & Soil Pollution, 164, 329-348.
Asian dust storms have been blamed for increased mortality in urban areas in Taiwan and South Korea. But is aeolian dust a significant hazard to human health? Test case: a non-industrial area near the source Meng, Z. and Lu, B. 2007. “Dust events as a risk factor for daily hospitalization for respiratory and cardiovascular diseases in Minqin, China.” Atmospheric Environment 41, 7048-7058.