Evaluating Meaningful Process Flow Charts for Business Improvement
This exercise involves reviewing and grading various process flow charts to identify the most meaningful ones for business success. Evaluate and assign grades based on effectiveness, with explanations for poor ratings. Practice critical thinking and analysis within a time limit of 10 minutes.

Evaluating Meaningful Process Flow Charts for Business Improvement
E N D
Presentation Transcript
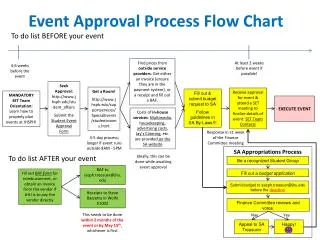
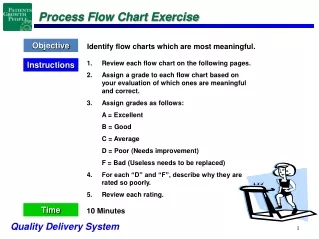
Process Flow Chart Exercise Objective Identify flow charts which are most meaningful. • Review each flow chart on the following pages. • Assign a grade to each flow chart based on your evaluation of which ones are meaningful and correct. • Assign grades as follows: A = Excellent B = Good C = Average D = Poor (Needs improvement) F = Bad (Useless needs to be replaced) • For each “D” and “F”, describe why they are rated so poorly. • Review each rating. Instructions Time 10 Minutes
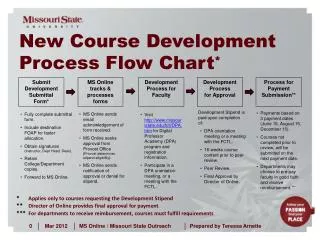
Process Flow Chart Exercise – Example 1 Unresponded Bills Solution Process Green = BDE Yellow = Carrier Blue = Bad Debt Team Orange = NRSC Grey = Systems 1. Requisitions are received in Billing Department 2. Sorter separates requisitions by carrier into bins 3. Requisitions are sent to Marker for Coding 4. Marker uses Billing Insurance Database to find appropriate mnemonic and marks requisition 7. Failures go to BDA and MIX Team 8. Successful transmissions enter into QBS and generate bills to Carriers from NRSC 5. BDE utilizes Billing Insurance Database to enter appropriate data into TopLab 6. TopLab Billing Information is run against BIP Edits 9. Carrier Pays or Denies (Rejects) Claim 10. No Response is received back from the Insurance Carrier 11. Bad Debt Team runs DYL Report each week, creating a report of all Bills sent 45 days ago for which no response (payment or denial) has been received 12. Information from DYL report is input into Excel, posted on a public shared drive, and distributed to Bad Debt Team 13. Bad Debt Team follow Procedure Manual to work all Unresponded claims 14. Bad Debt Team re-bills (BTTs) claims with corrected information, if possible 15. Bill is submitted to Carrier through the NRSC 16. Bill is Paid, Rejected, or remains Unresponded 17. After 5 weeks, Bad Debt Team Process Owner samples 300 requisitions that Unresponded Team worked to see what proportion have been paid 18. Bad Debt Team Process Owner reviews the findings and maps the data on a Control Chart and follows the Control Plan
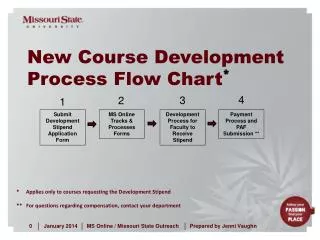
Process Flow Chart Exercise – Example 2 Improving Bad Debt Recovery Rate New process implemented: See workflow on next page
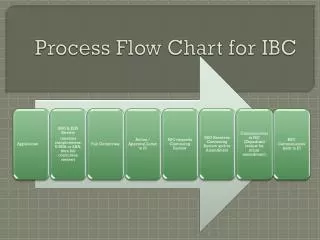
Process Flow Chart Exercise – Example 3 Reduction in Client Adjustments All client adjustments are categorized in QBS as follows: 1. Patient Issues 2. Pricing Issues 3. Testing Issues 4. Payment Issues
Quality Delivery System What is a Quality Delivery System? • It is a systematic relational description of all organization activities required to provide continuous customer satisfaction. • It describes how an organization changes customer requirements (CTQ’s) into customer satisfaction. • It links processes and measures throughout the organization.
…Process Flow Charts Things we do: …Indicators How we measure it: …Management Review Process How we improve it: Components of a Quality Delivery System A Quality Delivery System consists of:
Types of Processes What are the Types of Processes? Core Process: • Directly impacts the mission of the organization. • Directly affects the external customer. • Are sequenced and, together, meet external customer needs. Enabling (or Support) Processes: • Directly impact internal customers. • Support core processes and other enabling (or support) processes.
Outcome Indicators Numbering Guidelines Process flow charts will be numbered to show linkage to the entire Quality Delivery System (QDS). A process flow chart can be viewed from 3 perspectives: • Sequential Position - the order of occurrence. • Level Position - how low a step the process is flow charted. • Layer Position - identifies processes at the same level.
Process Flow Charts Flow Chart Perspectives: Sequential Position – a process will be numbered in accordance with the occurrence of the step in the next higher process. The starting point will be the macro level which is numbered “0.0”. The core processes will be numbered 1.0, 2.0, 3.0, etc. Level Position – the process is numbered according to the depth of the view from the Macro Level. For example: 3.5.2 Process is the second step flow charted of 3.5 Process. Layer Position – this exists when there are similar activities occurring at the same “level” of a process flow. These are denoted with capitalized letters. For example: 3P.5 Process where “p” stands for patient. Now let’s review Quest Diagnostics Revenue Services process flow numbering.
Colorado State Map (2nd Level MACRO) Denver City Map (MICRO) Process Flow Chart “Macro” versus “Micro” Concept U.S. Map (MACRO)
Process 2nd Level Macro Process 3nd Level Macro or Micro Overall Process Macro 0.0 Macro QDS 3.0 Title of Process 3.3 Title of Process A B C D E A B C B C WHO WHO WHO STEP STEP STEP 1 1 1 1 3.1 3.3.1 2 2 2 2 3.2 3.3.2 3 3 3 3 3.3 3.3.3 3.3 3 4 4 4 x3 x2 4 3.4 3.3.4 5 5 5 5 3.5 3.3.5 6 6 Y3 Y1 Y2 Legend: = Core Process (Or Subprocess) A, B, C, Etc. = Key Process Participants / Owners Process Flow Chart Levels
Symbols for Drawing a Chart • ELLIPSE (or circle) - an initial or final step often used for customer need (initial ellipse) and need met (final ellipse). • BOX - contains one (or more) actions with text starting with a verb(s). • DIAMOND - a decision question with “Yes” out the bottom and “No” out either side. • ARROW - the sequence (of flow) from one activity (or decision question) to another.
Flow Chart for the “Best Path” What is the “Best Path” in a flow chart? The “Best Path” in a flow chart is: • The quickest way to get from the start of the process to the end while meeting the customer’s needs. • A method to identify potential process improvements. • A tool used to identify where to measure processes. • A way to get employees to think about process improvement.
“Best Path” Flow Chart Construction Rules Flow Chart Construction Rules In order to ensure that your flow charts . . . . . . are clear, concise and easy to follow . . . accurately represent your process flow . . . help you perform Qualitative analysis . . . help you perform Quantitative analysis you will need to follow the following construction rules.
“Best Path” Flow Chart Construction Rules 1. Place process players (nouns) across the top. 2. Place process steps (verbs) down the left column.(Elapsed time can also be shown along the left column.) 3. Start and end with ellipses. The first action should be on the top row and the last action on the bottom row. 4. Boxes and ellipses represent actions with the text inside starting with a “VERB”.Boxes, ellipses and diamonds can be stretched when multiple players are involved. 5. Diamonds are “YES” and “NO” questions with “YES” always being downand representing the most direct or quickest process path. “NO” flows out either side of the diamond and often represents an undesirable rework condition or a longer duration process path. 6. Arrows should flow “In the Top” and “Out the Bottom”of boxes, ellipses, and diamonds. This ensures that each process step will have some vertical separation. 7. Only 1 arrow out of any box or ellipse. 8. Keep flow charts simple and on one page. Use a mix of Macro (general actions) and Micro (specific actions) boxes as needed to provide focus in the desired areas. • Avoid crossing arrow lines.Try swapping Dept./Person columns to accomplish this. • Place time down the left hand side.
“Best Path” Flow Chart Construction Rules • Review the SIPOC to identify high level steps of the process. • Key questions to ask while building the flow chart: • What happens next and who does that step? • Does this step have rework or does everything go fine? • When there is a decision, ask what would you like see happen? This is the “Yes” path. • When changing process players, you must have a process step (box) before a diamond. • Usually when you have a process step that contains approve, authorize, review, evaluate a diamond will follow.
If you have 3 possible locations (A, B, C) to receive an activity, you will need only 2 diamonds. Review File For Type NO Type A? NO YES Type B? YES Send To A Send To B Send To C • You can simplify the diamonds with the following rule: NO NO Type A & Type A? Under $500? If you circle only diamonds and YES YES count the NO NO Type A Or B outcomes ... you Type B? Under $10k? will then need 1 Send To A less diamond NO Under YES YES than the # of out $500? flowing arrows Send To B NO Send To C Under YES $10,000? Send To C YES Page 20 Send To A Send To B Send To C “Best Path” Flow Chart Construction Rules
“Best Path” Example Can you identify the “Best Path” in this process flow chart? Let’s review processes to identify the “Best Path”.
The process flow charts can be read in the following manner: How to Read Flow Charts
Doing the same thing over and over and expecting different results! Process Improvement Albert Einstein's Definition of Insanity: Therefore: WE MUST CHANGE THE PROCESS !!!
Process Improvement Processes can be improved with: • Qualitative Analysis – visually reviewing the process flow chart and identifying obvious improvement opportunities. • Quantitative Analysis – reviewing the process measures to identify process improvement opportunities.
Qualitative Improvement …involves reviewing flow charts LOOK ...for potential weaknesses.
Value Added Analysis Value-Added Steps : 1. Customers are willing to pay for it 2. It physically changes the product 3. It’s done right the first time Non-Value-Added Steps: 1. Not essential to produce output 2. Does not add value to the output • Include: • Defects, errors, omissions • Preparation/setup, control/inspection • Over-production, processing, inventory • Transporting, motion, waiting, delays
LOOK FOR VARIATIONS FROM THE BEST PROCESS PATH (i.e., VERTICAL FLOW) Value Added Analysis Non-Value Added Steps Include: 1. Multiple reviews, inspections, authorizations 2. Rework loops 3. Idle (dead, wait) time 4. Too many handoffs 5. Too many players / steps 6. Low value added steps 7. Duplicate steps 8. Poorly defined boundaries
Qualitative Analysis (Example 1) Process: Account Opening
Qualitative Analysis (Example 2) Setting Up An “Automated” Account
AFTER BEFORE 4TM.0 Submit Third Party Paper Claims (After) 4TM.0 Submit Third Party Paper Claims WHO National Revenue Service Center IT Headquarter WHO National Revenue Service Center Collections Carrier IT Headquarter STEP Data Center Collections Carrier Facilities Invoices And Claims STEP Data Center Facilities Invoices And Claims Need Claim Need Claim NEED Processed NEED Processed .01 Print Claims .01 Print Claims PRINT PRINT .02 E E SHIP T R .02 Ship To NRSC E A C SHIP T E 1 A .03 RECEIVE R Ship To NRSC Ÿ Receive Claims 0 . C Ÿ Deliver Claims 1 y 0 # Of Boxes Received .01 DELIVER .03 RECEIVE . 1 Ÿ Receive Claims Ÿ Deliver Claims .02 .01 DELIVER SORT Sort Claim Boxes .03 .02 OPEN Sort Claim Boxes SORT Open Boxes In Number Order Sort Claims By Entity .04 SORT Open Boxes In Number Order Is Sort New? .03 Balance To 4450 Report OPEN .05 NO Is BALANCE NO Claim Original Or Follow-Up? YES (WP6) Distribute To Associates .06 DISTRIBUTE YES Check For Special Handling List On Rebill Log Sheet .07 CHECK .04 Mailed Without LIST Special Handling? Mailed Without NO NO Perform Special Handling Special Handling? (WP3) YES YES Perform Is Claim Old Sort? Collection Perform Special Handling T Process I .08 T M NO .05 I B PERFORM M Is PERFORM U B Claim Original Or S U Is YES 2 S NO Follow-Up? 0 Is Claim Old Sort? . 2 Claim Not NO 0 .09 SORT . NO Commercial ? List On Rebill YES .10 LIST Sort By Par / Non-Par YES Log Sheet YES Commercial Address .06 BALANCE Check For Clearing House Balance To 4450 Report Is NO It Clearing House? .11 YES Check For Better .07 Distribute To Associates CHECK DISTRIBUTE 3PF Code .08 LOOK-UP 3PF NO Code Not Found? Look-Up Address YES Look-Up Address .09 Sort Claims By Carrier And ZIP .12 LOOK-UP SORT Perform .13 Collection PERFORM Process Perform BTT Claim To 3PF .10 Mail Claims Code MAIL .14 MAIL Mail Claims Y % Of Claims Returned / Week Y % Of Claims Delivered / Claims Queued For Printing Y % Of BTT Worked 1 Receive 1 SOURCE 3 SOURCE RECEIVE Processed RECEIVE # Of Claims For Each Print Category By Week (Special Handling, New Sort, Revised: 7/03/03 # Of Non-Par And Par Claims Y Revised: 7/14/03 Y Claim 2 Prepared By: Leon McCook Old Sort, And Rebills) (WP 1-6) 2 Prepared By: Leon McCook Receive Processed Claim Qualitative Analysis Improvemnt
Customer Requirements Critical To Quality Categories (Quality) 1. Accuracy , Defect Free (Cost) 2. Price to Customer or Insurer (Delivery) 3. Delivery Times, Turnaround Times (Service & Safety) 4. Product/Service Safety (Compliance) 5. Ethical Business Conduct, Environmental Impact, Legal Compliance NOTE:The key is to understand how your customers define and prioritize the various needs and expectations they have of your products and services.
Y Y x x Process Indicators Quality Outcome Indicator • Measures conformance to customer valid requirements • Shows “bottom line” quality for customer • Is usually set at the end-of-process In-Process Outcome Indicator • Measures results (or outcomes) within the process • Should provide “early warning” before the quality outcome indicator is affected • Is usually set within the process
Output vs. Outcome Indicators Always measure your processes with “Outcome” instead of “Output” indicators. What is the difference? What Are Output Indicators? Output Indicators are measures of counts of items from a process. Some examples are: • Number of units produced. • Percent of orders delivered. • Number of phone calls. • Number of lost time injuries. • Number of minutes worked. • Percent of items produced.
Outcome Indicators What Are Outcome Indicators? Outcome Indicators are measures of how well we are meeting our customers’ needs (i.e., conformance to customer valid requirements). Some examples are: • Number of defects per 10,000 units produced. • Percent of orders delivered later than customer requested delivery date. • Number of lost phone calls • Number of lost time injuries per 100 employees. • Number of minutes to provide service. • Percent of items in compliance with Federal Laws.
S O U R C E What: Who: When: Outcome Indicators Outcome Indicators are usually line graphs. Each outcome indicator has: • A good arrow to indicate the desired direction of the line. • A target indicating the level of performance acceptable to meet the customer valid requirement(s). Number of Days to Open Account GOOD # Of Days To Open Account Target 1 14 4 6 8 5 7 9 12 13 2 10 11 15 3 Accounts Opened
Outcome Indicators Criteria For Good Quality Outcome Indicators 1. Close “Fit” to Customer Valid Requirements 2. Accurate Data (Verifiable) 3. Low Cost to Collect Data 4. Understandable by Others 5. Roll-up (and Breakdown Capabilities)