Download
1 / 10
100 likes | 332 Vues
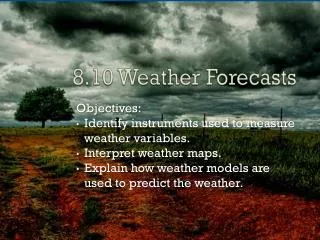
8.10 Weather Forecasts. Objectives: Identify instruments used to measure weather variables. Interpret weather maps. Explain how weather models are used to predict the weather. Measuring Weather. Meteorologists use special instruments to measure conditions in the atmosphere.

E N D
8.10 Weather Forecasts Objectives: Identify instruments used to measure weather variables. Interpret weather maps. Explain how weather models are used to predict the weather.
Measuring Weather • Meteorologists use special instruments to measure conditions in the atmosphere. • Thermometer to measure the variable temperature • Barometer, air pressure • Psychrometer, relative humidity • Anemometer, wind speed
Surface and Upper-Air Reports • A surface report describes a set of weather measurements made on Earth’s surface. • Measured at a weather station • An upper-air report described wind, temperature, and humidity conditions above the Earth’s surface. • Measured by a collection of weather instruments called a radiosonde. • On a weather balloon many kilometers above the ground.
Satellite and Radar Images • From 35 000 km above • Visible light shows clouds • Infrared gives thermal energy images. • Information: cloud height and atmospheric temperature.
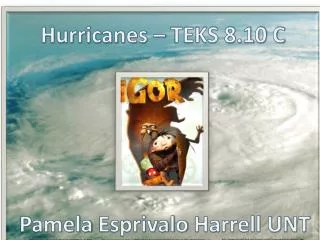
Satellite and Radar Images (continued) • Radar measures precipitation when radio waves bounce off raindrops and snowflakes. • Doppler radar is a specialized type of radar that can detect precipitation as well as the movement of other small particles, which can approximate wind speed. This dopplerradar image of Hurricane Dolly as it hit Texas was made by pulsing microwave radiation and measuring the time of arrival of the pulses.
Weather Maps • Weather maps are tools for simplifying a huge amount of weather data. • The Station Model • Displays data from many measurements for a specific location.
Mapping Temperature and Pressure (continued) • Isobars are lines that connect all places on a map where pressure has the same value. • Can give information on wind speed: Wind speeds are stronger when isobars are closer together. • Isotherms (not shown on the next slide) are lines that connect places that have the same ____?___. • Fronts are represented with lines with symbols on them.
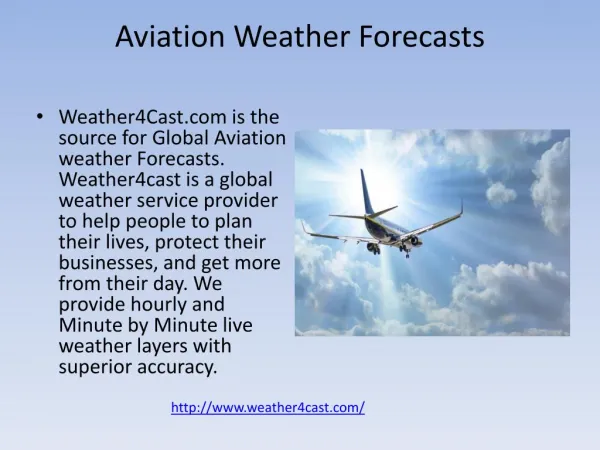
Predicting the Weather • Weather forecasts are made with the help of computer models. • Computer models are detailed computer programs that solve a set of complex mathematical formulas. • Formulas predict weather conditions. • Forecasts made available to public through TV, radio, newspapers and Internet.