Download
1 / 60
600 likes | 799 Vues
You can be pro-consumer and pro-renewable energy. The Wind has changed directions. New policies on energy are emerging. ENERGY INDEPENDENCE ENVIRONMENTAL CONCERNS UPWARD PRICING TRENDS ON FOSSIL FUELS WATER RESOURCES. MN: 25% by 2025 (Xcel: 30% by 2020). ME: 30% by 2000

E N D
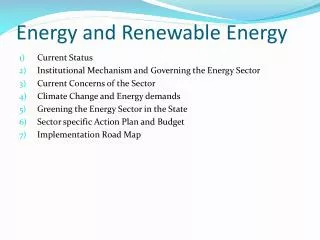
New policies on energy are emerging • ENERGY INDEPENDENCE • ENVIRONMENTAL CONCERNS • UPWARD PRICING TRENDS ON FOSSIL FUELS • WATER RESOURCES
MN: 25% by 2025 (Xcel: 30% by 2020) ME: 30% by 2000 10% by 2017 - new RE VT: RE meets load growth by 2012 *WA: 15% by 2020 ND: 10% by 2015 • NH: 23.8% in 2025 OR: 25% by 2025(large utilities) 5% - 10% by 2025 (smaller utilities) WI: requirement varies by utility; 10% by 2015 goal MA: 4% by 2009 + 1% annual increase MT: 15% by 2015 RI: 16% by 2020 CT: 23% by 2020 • *NV: 20% by 2015 IA: 105 MW • NY: 24% by 2013 • CO: 20% by 2020(IOUs) *10% by 2020 (co-ops & large munis) IL: 25% by 2025 • NJ: 22.5% by 2021 CA: 20% by 2010 • PA: 18%¹ by 2020 MO: 11% by 2020 • MD: 9.5% in 2022 • NC: 12.5% by 2021(IOUs) 10% by 2018 (co-ops & munis) • AZ: 15% by 2025 • *DE: 20% by 2019 • DC: 11% by 2022 • NM: 20% by 2020(IOUs) • 10% by 2020 (co-ops) *VA: 12% by 2022 TX: 5,880 MW by 2015 State RPS HI: 20% by 2020 State Goal Solar water heating eligible State RPS Requirements RPS: Renewable Portfolio Standard, also known as Renewable Energy Standards
20% Wind Energy by 2030: Increasing Wind Energy’s Contribution to U.S. Electricity Supply www.20percentwind.org
20% Wind Scenario Explores one scenario for reaching 20% wind electricity by 2030 Is not a prediction, but an analysis based on one scenario Would require about 300 GW (300,000 MW) of wind generation- an increase of about 290 GW in wind installations between 2007 to 2030 Brings net consumer savings
Annual Wind Capacity Installation • U.S is more than • 25% of global market • Annual Installation • in 2007: 20,000 MW • - U.S.: 5,200 MW • Spain: 3,400 MW • China: 3,400 MW • India: 1,800 MW
18 16 14 12 10 8 6 4 2 0 Actual Annual Installed Capacity (GW) Actual installations in 2007: 5,329 MW Current projected 2008:Over 5,000 MW 6 8 0 2 4 6 8 0 2 0 0 1 1 1 1 1 2 2 0 0 0 0 0 0 0 0 0 2 2 2 2 2 2 2 2 2 Annual GW Installed
Electric Sector Costs of the 20% Wind Scenario 2% investment difference between 20% Wind and No New Wind
20% Wind Scenario Impact on Generation Mix in 2030 Reduces electric utility natural gas consumption by 50% Reduces total natural gas consumption by 11% Natural gas consumer benefits: $86-214 billion* Reduces 18% electric utility coal consumption Avoids construction of 80 GW of new coal power plants U.S. electrical energy mix Source *: Hand et al., 2008
4,500 4,000 3,500 3,000 2,500 2,000 1,500 No New Wind Scenario CO emissions 1,000 2 20% Wind Scenario CO emissions 2 USCAP path to 80% below today s levels by 2050 500 0 2006 2010 2014 2018 2022 2026 2030 r o t c e S c i ) r s t c n e o l t E c i e r t h e t m n i n s o n i l o l i i s m s ( i m E 2 O C ’
CO2 emissions reductions by 2030= ~825 million metric tons annually Could avoid~$98 Billion* CO2 regulation cost Source *: Hand et al., 2008
Incremental Cost of Scenario Compared to Natural Gas Fuel Savings from 2007-2030 The savings from reduced natural gas and fuel use to the U.S. economy would be $150 billion, far exceeding the incremental cost of investing in the 20% Scenario. Dollars* • *NPV • Source: Hand et al., 2008
Significant Water Use Savings Cumulatively, the 20% Wind Scenario would avoid the consumption of 4 trillion gallons of water through 2030. The 20% Wind Scenario cuts electric sector water consumption by 17% in 2030. 500 400 d e v a S 300 s n o l l a G n 200 o i l l i B 100 0 2008 2010 2012 2014 2016 2018 2020 2022 2024 2026 2028 2030 Year
Jobs Supported by the 20% Scenario Over 500,000 jobs supported by the 20% Scenario Approx. 180,000 directly employed by wind
Summary: Costs & Benefits Sources: DOE, 2008 and Hand et al., 2008
Need for New Transmission: Existing and New in 2030 Wind (MW) Used Inside the BA Wind (MW) on Transmission Lines 100-300 300-500 Existing New 100-200 500-1000 1000-5000 200-500 >5000 500-1000 >1000
Should advocates argue for renewable energy? • The work of consumer advocates is critical to providing balance to the process of regulatory oversight in the world of monopoly utilities. • The paradigm has changed in regard to decisions about the choice of generation.
Consumers and renewables • RPS states • Non RPS states: has a proper evaluation been done in determining the appropriate generation mix? • Hedging • Modeling analysis • Modeling with appropriate inputs on the likelihood of carbon restrictions and reasonable cost predictions
Who will argue that renewables are the most prudent choice? Utilities? Staff? Industrials? Environmental groups?
COST/BENEFIT • Consumer advocates guard against unnecessarily increasing consumer costs. With limited resources it may be difficult to pay for an analysis necessary to argue against the utilities premise that renewables are more expensive. In fact it may be easier to just take the position that it is up to the utility to make the prudent choice. This can result in a scenario where it is up to the utility and environmental interests to be advocates for renewable generation because it is the “right thing to do,” but there is limited advocacy for this generation on the basis that it is the best choice for consumers when examining all areas including cost.
Why should consumer advocates argue for renewable energy? • The addition of renewable energy is frequently in the best interests of consumers. • Policies of some states mandate the use of renewables. • Hedge against the upward pressures of fuel prices for gas and coal generation. For wind THE FUEL IS FREE! • Significant potential for the implementation of carbon restrictions. • Savings from lowered demand for natural gas.
Renewables can save money for consumers? • At least two studies have been done on a statewide level which show that adding renewables to the generation mix is a cost saver not a cost causer. • Colorado • Missouri
Colorado Study • A “backcasting” econometric study released by the Interwest Energy Alliance documents the significant savings that wind energy will provide to Xcel Energy’s customers…and quantifies the savings consumers would have enjoyed if Xcel Energy (Public Service Company of Colorado, "PSCo") had acquired more wind energy during its solicitations in 1999, 2004 and 2005.
Colorado Study • This study examines the savings that wind generation has produced for the PSCo system in two scenarios: • a base case that examines the amount of wind that PSCo agreed to build on its system through its last three resource solicitations (1999, 2004, and 2005); • an alternative scenario that proposed the addition of a reasonable amount of incremental wind to the PSCo system in response to each of the three solicitations.
Colorado Study • The cost savings for wind generation that PSCo had already acquired would produce more than $251 million in fuel and emissions costs in savings for PSCo ratepayers. • Had PSCo decided to acquire additional wind generation, this study calculates that Colorado ratepayers would have saved $438 million over the life of these contracts, an additional $186 million over the savings that would be achieved based on Xcel’s past decisions.
Missouri Study • Sponsored by The Missouri Coalition for the Environment Funded by The Energy Foundation Study authored by Martin R. Cohen Fall 2008 • The proposed Renewable Electricity Standard for Missouri is set at 15% by 2021 • Section 393.1030 of the proposed Missouri law includes a provision requiring that expenditures for renewable power be limited to: • “(a) A maximum average retail rate increase of one percent determined by estimating and comparing the electric utility’s cost of compliance with least-cost renewable generation and the cost of continuing to generate or purchase electricity from entirely non-renewable sources, taking into proper account future environmental regulatory risk including the risk of greenhouse gas regulation;”
Missouri Study • By 2021, the full costs of renewable power would be less than the operation, maintenance, fuel and carbon emission costs of the fossil power it would replace (not including any new plant construction costs or capital additions to fossil plants).
Missouri Study • Under the most likely set of cost assumptions, if Missouri utilities were to procure power from renewable sources in the amounts required by the referendum (instead of generating that power with natural gas and coal-fired power plants), the typical residential customer, who presently pays an electric bill averaging about $80 per month, would see net monthly savings of 25 cents over the 20-year study period, compared to what electricity would otherwise cost.
Conclusion • Wind energy will be an important part of the energy future of the United States. • Despite the claims and inferences that are often made about wind energy, the studies above indicate that renewables can bring a net benefit to consumers. • Consumer advocates have a critical part to play if consumers are to have access to the range of benefits of renewable energy.
Steve Gaw The Wind Coalition http://www.windcoalition.org/index.php
OWNERSHIP vs. PPA • Scrutiny is needed to ensure that due diligence has been performed by the utility in seeking the best deal for customers. • NARUC FERC?????
FERC/NARUC COLLABORATIVE OUTLINES • “BEST PRACTICES” FOR COMPETITIVE PROCUREMENT • The Federal Energy Regulatory Commission (FERC) and the National Association of Regulatory Utility Commissioners (NARUC) on July 20 jointly released a report as part of their collaborative dialogue on competitive procurement. The report, titled Competitive Procurement of Retail Electricity Supply: Recent Trends in State Policies and Utility Practices and prepared by the Analysis Group, offers a list of “best practices” to ensure a fair and objective system of encouraging robust competition. EPSA urges states to implement the report’s best practices and adopt competitive procurement rules if they are not already in place to provide consumers with the best possible deal. • “Because the utility’s (and/or its parent’s) financial interests may not be aligned with those of its customers when the utility selects from among the options, extra care is needed to prevent improper self-dealing by the utility. Best practices under these circumstances require a higher degree of regulatory supervision and scrutiny, such as the use of an independent monitor tasked to be the eyes and ears of the regulator and to help bolster the procurement’s fundamental fairness and objectivity.” (p. 12)
“If a commission decides to rely on competitive processes, its own actions to enforce fundamental fairness objectives and uphold any prior commitments to use markets are a critical component of the process of identifying the ‘best’ retail supply for utility customers.” (p. 7) • “Participation by suppliers, commissions, the public, and independent monitors can be important to ensuring a fair and objective process. Such participation early in the process can also help to avoid (or at least lessen) later regulatory disputes by providing opportunities for differences of opinion, misunderstandings, or information problems to be resolved ahead of the competitive solicitation itself.” (p. 20) • “When considering whether to allow utilities to use some form of risk-adjustment adder to compare contracts against self-build options in the context of competitive procurements, commissions should be mindful of what they already know in general – that is, that the inferred debt adjustment made by credit agencies is not the only impact on credit ratings from a utility signing a PPA.” (Appendix C, p. 8) • The full report can be found at http://www.naruc.org/resources.cfm?p=141 • * * * • EPSA is the national trade association representing competitive power suppliers, including generators and marketers. These suppliers, who account for nearly 40 percent of the installed generating capacity, provide reliable and competitively priced electricity from environmentally responsible facilities. For more information, go to www.epsa.org.
“… because the large capital investments necessary for development of these types of resources pose potentially valuable opportunities for utilities to enter new resources into rate base, commissions should be aware that utilities may attempt to shield such projects from competition even in situations where market processes are applicable. Despite these challenges, the potential economic gains from imposing the market discipline of competitive procurements on development of capital-intensive and advanced technologies may be great.” (p. 19) • “Procurements must include appropriate safeguards to prevent undue preferential treatment of any offers, to ensure that procurements are implemented as designed, and to ensure that unforeseen circumstances are addressed in a manner that is fair and fundamentally consistent with the competitive intent of the process.” (p.ii) • “…as many states have determined, the benefits of [independent monitors of competitive procurements] seem to outweigh these costs in most instances, and are a necessary element of a credible process where the utility itself has a financial stake in the outcome of the competitive procurement itself.” (p. 22)
Missouri Study • The Renewable Electricity Standard would add a significant amount of renewable energy to the electricity mix in Missouri, but would have a small effect on ratepayers’ electricity bills. Because of increasing costs for fossil fuels and the likely imposition of constraints on greenhouse gas emissions, the RES would produce net savings to electricity customers over time as local wind, solar, and other renewable resources supplant coal and natural gas.
Missouri Study • The RES would not cost the average residential customer more than 68 cents per month in any year. The average net cost over the first ten years of the RES (from 2011 through 2020) would be 36 cents per month for the typical household2. During the second decade of the RES, the typical household would save an average of 86 cents per month. By 2030, the average residential consumer would save $1.65 per month compared to the zero-renewables reference case.
The annual average cost of electricity under the RES requirement would never exceed one percent more than the cost would be without any renewable power. Over the first ten years, the difference in cost between the fossil fuel portfolio and the part-renewable portfolio would average less than one-half of one percent (0.47 percent). Net costs totaling $210 million over the first ten years would be followed by net savings totaling $541 million over the next ten years, resulting in cumulative net savings of $331 million. Averaged over the entire 20-year study period, the RES would reduce electricity costs by an average of about one-quarter of one percent (0.26 percent).
So are renewables more expensive? • The argument that renewables are risky or more expensive sometimes meets with acceptance or indifference within the parties or interest groups. • Those promoting the use of renewable energy can be focused on objectives other than consumer costs. • Environmental objectives • Business goals • Utilities will benefit from greater awards for risk and costs. Thus, there is an incentive to argue that renewables are more expensive and involve more risk.