Download
1 / 51
510 likes | 604 Vues
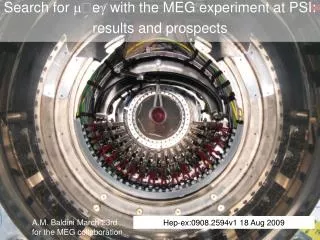
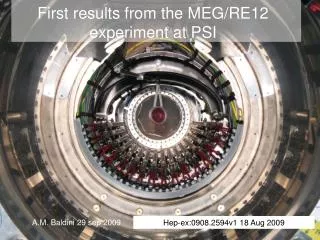
First results from the MEG/RE12 experiment at PSI. A.M. Baldini 29 sep 2009. Hep-ex:0908.2594v1 18 Aug 2009. Most recent m + e + g Experiments. Two orders of magnitude improvement tough experimental challenge! But

E N D
First results from the MEG/RE12 experiment at PSI A.M. Baldini 29 sep 2009 Hep-ex:0908.2594v1 18 Aug 2009
Most recent m+ e+g Experiments Two orders of magnitude improvement tough experimental challenge! But several SUSY GUT and SUSY see-saw models predict BRs at the reach of MEG
SUSY SU(5) predictions BR (meg) 10-14 10-13 SUSY SO(10) predictions BRSO(10) 100 BRSU(5) Experimental limit Our goal SUSY-GUT (SUGRA) First contribution: VCKM cLFV LFV induced by slepton mixing R. Barbieri et al., Phys. Lett. B338(1994) 212 R. Barbieri et al.,Nucl. Phys. B445(1995) 215 combinedLEP results favour tanb>10
Experimental limit Our goal VPMNS (n oscillations) cLFV Independent contribution toslepton mixingfrom n masses (see-saw model): V less known J. Hisano, N. Nomura, Phys. Rev. D59 (1999) tan(b)=30 tan(b)=1 After SNO After Kamland in the Standard Model !! If it is seen it is not SM!
e+ +g e+ +g n n n n e+ + Signal and background background signal eg accidental en n egn n ee g g eZ eZ g physical egn n qeg = 180° Ee= Eg=52.8MeV Te = Tg g
The sensitivity is limited by theaccidental background The n. of acc. backg events (nacc.b.) depends quadratically on the muon rateand on how well we measure the experimental quantities: e-g relative timing and angle, positron and photon energy Effective BRback (nback/Rm T) Integral on the detector resolutions of the Michel and radiative decay spectra
Required Performances BR (meg) 10-13 reachable BRacc.b. 2 10-14 and BRphys.b. 0.1 BRacc.b.with the following resolutions FWHM Need of a DC muon beam
Experimental method • Detector outline • Stopped beam of 3 107 /sec in a 150 mm target • Solenoid spectrometer & drift chambers fore+ momentum • Scintillation counters for e+ timing • Liquid Xenon calorimeter for detection (scintillation) • Method proposed in 1998: PSI-RR-99-05: 10-14 possibility • MEG proposal: september 2002: 10-13 goal: A. Baldini and T. Mori spokespersons: Italy, Japan, Switzerland, Russia
Detector Construction Switzerland Drift Chambers Beam Line DAQ Russia LXe Tests Beam line Italy e+ counter Trigger LXe Calorimeter Japan LXe Calorimeter,Spectrometer’s magnet USA(UCI) Calibrations/Target/DC pressure system
Next slides... • The PSI pE5 beamline • The Positron spectrometer • The Liquid Xenon calorimeter • DAQ • The 2008 run • Future
Primary proton beam 1) The PSI pE5 DC beam Particles intensity as a function of the selected momentum m+ • 1.8 mA of 590 MeV/c protons (most intense DC beam in the world) • 29 MeV/c muons from decay of stop at rest: fully polarized
Beam studies • Optimization of the beam elements: • Wien filterform/e separation • Degrader to reduce the momentum stopping in a150mmCH2target • Solenoid to couplebeam with COBRA spectrometer • Results (4 cm target): • Z-version • Rm(total)1.3*108m+/s • Rm(after W.filter & Coll.) 1.1*108m+/s • Rm(stop in target)6*107m+/s • Beam spot (target)s 10 mm • m/e separation (at collimator)7.5s(12 cm) 108m/s could be stopped in the target but only 3x10⁷ are used because of accidental background
Gradient field Uniform field Gradient field Uniform field 2) The positron spectrometer: COBRA spectrometer COnstantBendingRAdius(COBRA) spectrometer • High pT positrons quickly swept out • Constant bending radius independent of emission angles
The magnet • Bc = 1.26T current = 359A • Five coils with three different diameters • Compensation coils to suppress the stray field around the LXe detector • High-strength aluminum stabilized superconductor • thin magnet (1.46 cm Aluminum, 0.2 X0)
The drift chambers • 16 chamber sectors aligned radially with 10°intervals • Two staggered arrays of drift cells • Chamber gas: He-C2H6 mixture • Vernier pattern to measure z-position made of 15 mm kapton foils goals (X,Y) ~200 mm (drift time) (Z) ~ 300 mm (charge division vernier strips)
The Timing Counter BC404 • One (outer) layer of scintillator read by PMTs : timing • One inner layer of scintillating fibers read by APDs: trigger (the long. Position • is needed for a fast estimate of the positron direction) • Goal time~ 40 psec (100 ps FWHM) 5 x 5 mm2
APD Cooled Support TC Final Design APD F.E. Board Fibers • A PLASTIC SUPPORT STRUCTURE ARRANGES THE SCINTILLATOR BARS AS REQUESTED • THE BARS ARE GLUED ONTO THE SUPPORT • INTERFACE ELEMENTS ARE GLUED ONTO THE BARS AND SUPPORT THE FIBRES • FIBRES ARE GLUED AS WELL • TEMPORARY ALUMINIUM BEAMS ARE USED TO HANDLE THE DETECTOR DURING INSTALLATION • PTFE SLIDERS WILL ENSURE A SMOOTH MOTION ALONG THE RAILS APD PM Divider Board Main Support Scintillator Slab Scintillator Housing PM-Scintillator Coupler
800 l of Liquid Xe 848 PMT immersed in LXe Only scintillation light High luminosity Unsegmented volume H.V. Refrigerator Signals Cooling pipe Vacuum for thermal insulation Al Honeycomb Liq. Xe window PMT filler Plastic 1.5m 3) The Liquid Xe calorimeter Experimental check In a Large Prototype
PMT development OK!
Xenon purification New (2009) liquid phase purification system completely made inside the collaboration (F. Sergiampietri)
m radiative decay Laser 20 cm 3 cm LED Laser Lower beam intensity < 107 Is necessary to reduce pile-ups Better st, makes it possible to take data with higher beam intensity A few days ~ 1 week to get enough statistics g e m (rough) relative timing calib. < 2~3 nsec n n PMT Gain Higher V with light att. Can be repeated frequently p0 gg p- + p p0 + n p0 gg (55MeV, 83MeV) p- + p g + n (129MeV) 10 days to scan all volume precisely (faster scan possible with less points) LH2 target alpha Xenon Calibration PMT QE & Att. L Cold GXe LXe e+ g e- Nickel g Generator Proton Acc Li(p,)Be LiF target at COBRA center 17.6MeV g ~daily calib. Can be used also for initial setup 9 MeV Nickelγ-line on off quelle K Bi NaI Illuminate Xe from the back Source (Cf) transferred by comp air on/off Tl Li(p, 1) at 14.6 MeV F Polyethylene 0.25 cm Nickel plate Li(p, 0) at 17.6 MeV
Calorimeter energy Resolution and uniformity at 55 MeV by means of Energy resolution on the calorimer Entrance face sR = 1.5% FWHM = 4.6 %
LiF target LITHIUM - spectrum + FLUORINE - spectrum Automatic insertion/Extraction from the experiment center (target)
2 boards LXe inner face (312 PMT) . . . . . . 10 boards 20 boards 1 board LXe lateral faces (488 PMT: 4 to 1 fan-in) 1 board 2 x 48 Type1 Type1 Type1 Type1 Type1 Type1 Type1 Type1 Type1 12 boards 2 boards 3 16 16 3 16 3 . . . Timing counters (160 PMT) Type2 Type2 Type2 Type2 Type2 Type2 2 VME 6U 1 VME 9U 2 x 48 4 x 48 20 x 48 12 x 48 10 x 48 4) DAQ: trigger • Uses easily quantities: • energy • Positron- coincidence in time and direction • Built on a FADC-FPGA architecture • More complex algorithms implementable • Beam rate 108 s-1 • Fast LXe energy sum > 45MeV 2103 s-1 g interaction point (PMT of max charge) e+ hit point in timing counter • time correlation g – e+ 200 s-1 • angular correlation g – e+ 20 s-1 5 Hz in 2008 data taking
On-line Eγresolution 55 MeVγ-line from π0-decay σ= 3.8% 45 MeV threshold (@4s from signal)
DAQ: readout The Domino Principle 0.2-2 ns Inverter “Domino” ring chain IN Waveform stored Out FADC 33 MHz Clock Shift Register “Time stretcher” GHz MHz Keep Domino wave running in a circular fashion and stop by trigger Domino Ring Sampler (DRS) Low cost One “oscilloscope” per channel
Liquid xenon: waveforms: 2 digitizers Trigger@100 MHz DRS2 @ 500 MHz or 2 GHz
4) 2008 run • - First 3 months physics data taking (september-december 2008) • DCHs instability on part of the chambers after some months of operation: reduction of efficiency to 30% (now 2009 corrected: new HV distribution system ) • Xe LY increase (now 2009 at the nominal value) CW Calibration each three days during 2008 run
2008 2009
In 2009 xenon scintillation waveforms have the right time decay constant: longer for gammas 2008 2009
RD RD RD RD RD RD 2008 run : 1014 muons stopped in target We also took RMD data once/week at reduced beam intensity Programmed beam shutdowns Air test in COBRA Cooling system repair
DCH resolutions from 2008 data Tracks with two turns in the spectrometer are used to detetrmine the Angular resolutions s(Df) =14 mrad s(f)=10 mrad The edge of Michel positrons used to determine momentum resolution score = 374 keV (60%) stail1 = 1.06 MeV (33%) stail2 = 2 MeV (7%) s(Dq) = 25 mrad s(q) = 18 mrad
Timing resolutions from 2008 data Photon - positron timing resolution by using Radiative muon decay: physical background Intrinsic timing resolution by using positrons hitting several bars DT 80 ps Problems with DRS2 : will improve with DRS4
Sidebands (|DTeg| > 1 ns ) are used to MEASURE accidental background distributions g Energy Radiative decay + In flight positron annihilation + resolution + pileup: in agreement with MCs
Likelihood analysis: accidentals + radiative + signal PDFs to fit data + Feldman Cousins Best fit in the signal region Agreement of 3 different analyses
Normalization: measured Michel eventssimultaneous with the normal MEG trigger dove: pre-scaling 107 • Independent of instantaneous beam rate • Nearly insensitive to positron acceptance and efficiency factors associated with DCH and TC
90% CL limit • 90 % C.L. NSig 14.6 corresponds to BR(m→eg) 3.0 x 10⁻¹¹ • Computed sensitivity1.3 x 10-11 • Statistical fluctuation 5% • From side bands analysis we expected 0.9 (left) and 2.1 (right) x 10-11 • Bad luck
Future prospects • Re-start of data taking in september, until december (as in 2008) • Instabilities eliminated: DRS2DRS4 (timing improvement + noise reduction) • Data taking and trigger efficiencies: 3-5 factor improvement • Corresponding improvement in sensitivity: 2-4 * 10-12 for 2009 run • Continue running in 2010 + 2011 for the final (10-13) goal Proposal now LoI Planning R & D Assembly Data Taking 1998 1999 2000 2001 2002 2003 2004 2005 2006 2007 2008 2009 2010 2011 http://meg.psi.ch http://meg.pi.infn.it http://meg.icepp.s.u-tokyo.ac.jp More details at
Pm (Y. Kuno et al., MEG TN1, 1997 and references) Det. 1 Det. 2 • For suitable geometry big factors can be obtained • This is not the case for MEG (detailed calculations are necessary ) • In some theories (minimal SU(5) model) the positron has a definite helicity Pm is less effective