STAT E-150: Week 11 Multiple Logistic Regression
STAT E-150: Week 11 Multiple Logistic Regression. By Kela Roberts. Section Overview. Questions HW Questions Review Key Concepts from Logistic Regression Sample Questions Additional Questions. Homework Review. Wald statistic – checks each individual term in the logistic model

STAT E-150: Week 11 Multiple Logistic Regression
E N D
Presentation Transcript
STAT E-150: Week 11Multiple Logistic Regression By Kela Roberts
Section Overview • Questions • HW Questions Review • Key Concepts from Logistic Regression • Sample Questions • Additional Questions
Homework Review Wald statistic – checks each individual term in the logistic model Log likelihood – to compare 2 models Omnibus – overall test for multiple logistic regression
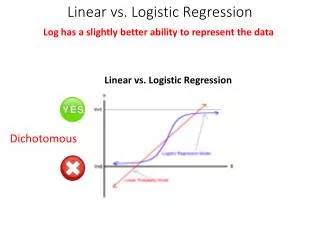
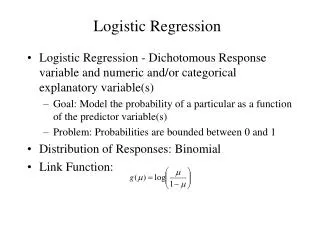
Multiple Logistic Regression Model: y= log(odds) = β0 + β1 x + β2x E(y) = p, the probability of success We transform the odds, using the natural logarithm, and we use the term log odds or logit for this transformation.
Multiple Logistic Regression y= log(odds) = β0 + β1x+ β2x If log(odds) changes by β1then odds increases by In other words, the change in odds associated with a unit change in x is , which can be denoted on SPSS as Exp(b1).
Multiple Logistic Regression Finding the best model: 2-Log likelihood test - can be used to assess how well a model would fit the data, this doesn’t tell us much by itself but it is critical for comparisons. Assumptions/Conditions – Linearity: Box-Tidwell Test – Independence: No pairing or clustering of the data in space – Random: Need to make sure a ‘spinner model’ is valid – super important!!
Sample Question Which predictors increase the odds of being an honors student? This data was collected on 200 high schools students and are scores on various tests, including science, reading, and the presence (or absence) of a social studies course for 1 semester (ses(1)) or for 2 semesters (ses(2)).[1] Here is the output from the full model: [1] http://www.ats.ucla.edu/stat/spss/output/logistic.htm
Sample Question Which predictors increase the odds of being an honors student? This data was collected on 200 high schools students and are scores on various tests, including science, reading, and the presence (or absence) of a social studies course for 1 semester (ses(1)) or for 2 semesters (ses(2)).[1] Here is the output from the reduced model: [1] http://www.ats.ucla.edu/stat/spss/output/logistic.htm
Sample Question Which predictors increase the odds of being an honors student? This data was collected on 200 high schools students and are scores on various tests, including science, reading, and the presence (or absence) of a social studies course for 1 semester (ses(1)) or for 2 semesters (ses(2)).[1] Here is the output from Variables in the Equation Box: [1] http://www.ats.ucla.edu/stat/spss/output/logistic.htm
Sample Question Which predictors increase the odds of being an honors student? Here is the output from Variables in the Equation Box: What is the overall model including all predictors based on the output above? [1] http://www.ats.ucla.edu/stat/spss/output/logistic.htm
Sample Question Which predictors increase the odds of being an honors student? Here is the output from Variables in the Equation Box: What is the overall model including all predictors based on the output above? log(odds) = -9.561 + 0.098*xread + 0.066*xscience + 0.058*xses(1) - 1.013*xses(2) [1] http://www.ats.ucla.edu/stat/spss/output/logistic.htm
Sample Question Which predictors increase the odds of being an honors student? Here is the output from Variables in the Equation Box: • What is the model including predictors at a 0.05 significance level based on the output above (reduced model)? [1] http://www.ats.ucla.edu/stat/spss/output/logistic.htm
Sample Question Which predictors increase the odds of being an honors student? Here is the output from Variables in the Equation Box: • What is the model including predictors at a 0.05 significance level based on the output above (reduced model)? • log(odds) = -9.561 + 0.098*xread + 0.066*xscience - 1.013*xses(2) [1] http://www.ats.ucla.edu/stat/spss/output/logistic.htm
Sample Question Which predictors increase the odds of being an honors student? Here is the output from Variables in the Equation Box: • Which model is more useful? [1] http://www.ats.ucla.edu/stat/spss/output/logistic.htm
Sample Question Which predictors increase the odds of being an honors student? Here is the output from Variables in the Equation Box: • Which model is more useful? • According to the model summary, the full model is more useful. • Test statistic: 87.336 – 81.781 = 5.555 • DF = 1 since we removed 1 term • http://www.fourmilab.ch/rpkp/experiments/analysis/chiCalc.html [1] http://www.ats.ucla.edu/stat/spss/output/logistic.htm
Sample Question Which predictors increase the odds of being an honors student? Here is the output from Variables in the Equation Box: • What is the probability of being an honors student given 2 semesters of social science and test scores in reading of 95% and science 75%? [1] http://www.ats.ucla.edu/stat/spss/output/logistic.htm
Sample Question Which predictors increase the odds of being an honors student? Here is the output from Variables in the Equation Box: • What is the probability of being an honors student given 2 semesters of social science and test scores in reading of 95% and science 75%? [1] http://www.ats.ucla.edu/stat/spss/output/logistic.htm
Sample Question Which predictors increase the odds of being an honors student? Here is the output from Variables in the Equation Box: • What is the probability of being an honors student given 2 semesters of social science and test scores in reading of 95% and science 75%? [1] http://www.ats.ucla.edu/stat/spss/output/logistic.htm