Crop Condition Anomalies and Leaf Area Index Analysis from SPOT Vegetation Data
20 likes | 147 Vues
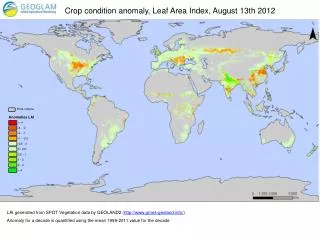
This report presents an analysis of crop condition anomalies and Leaf Area Index (LAI) for August 13, 2012, generated using SPOT Vegetation data via GEOLAND2. The anomalies across a decade are quantified against the mean values from 1999 to 2011. The images are derived from LAI data utilizing daily surface reflectance datasets from the VEGETATION sensor on Spot 4 and Spot 5 satellites. Cultivated areas are identified using various land cover products, ensuring comprehensive spatial awareness. The map was produced by the TETIS laboratory, showcasing a collaborative effort in agricultural monitoring.

Crop Condition Anomalies and Leaf Area Index Analysis from SPOT Vegetation Data
E N D
Presentation Transcript
Crop condition anomaly, Leaf Area Index, August 13th 2012 Hors culture LAI generated from SPOT Vegetation data by GEOLAND2 (http://www.gmes-geoland.info/) Anomaly for a decade is quantified using the mean 1999-2011 value for the decade
Sources • Images were created using the LAI data generated by GEOLAND2 (http://www.gmes-geoland.info/) from daily surface reflectance dataset from VEGETATION sensor on board Spot4 and Spot5 satellites (CNES). • Cultivated areas are depicted using a combination of the following products: US- NLCD, Europe- CORINE, rest of world- MODIS UMD Landcover • Map created by TETIS laboratory (Cirad, Irstea, AgroParisTech) (Audrey Jolivot, Kenji Ose, Pascal Kosuth)