Download
1 / 16
160 likes | 180 Vues
This presentation provides an overview of Enron's electricity issues, including wholesale energy operations, retail energy services, and broadband delivery services. It also highlights Enron's expansion into new commodity markets and its role as a market maker.

E N D
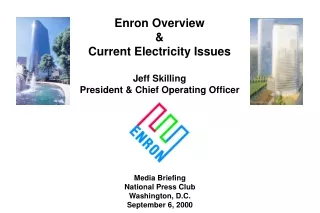
Enron Overview&Current Electricity IssuesJeff SkillingPresident & Chief Operating Officer Media Briefing National Press Club Washington, D.C. September 6, 2000
Wholesale Energy Transportation & Distribution Broadband Services Retail Energy Net Works Bandwidth Managementand Broadband Delivery Services Energy Outsourcingto Commercial and Industrial Customers Natural Gas Transportation and Electric Distribution Marketing and Delivery of Energy Products Worldwide Expansion Vehicle for New CommodityMarket Penetration
Wholesale Energy Operations and Services Income Before Interest and Taxes (Millions) Physical Volumes (BBtue/d) 32,429 $1,317 27,308 $968 17,970 $654 12,392 $466 $401 8,966 1995 1996 1997 1998 1999 1995 1996 1997 1998 1999 35% Compounded Annual Growth Rate 38% Compounded Annual Growth Rate 37%+ CAGR
Enron Energy ServicesFirst Half Performance(Millions) Contracting (Total Contract Value) EBIT Revenues $1,482 $7,500 $40 ($57) ($70) $710 $3,400 $349 $1,400 1998 1999 2000 1998 1999 2000 1998 1999 2000
QUEBECOR INC Sonoco Inc. First Half 2000 Contracting Activity $1 Billion, 10-Year Agreement to Service 66 Facilities in 28 States $610 Million, 10-Year Agreement to Service 10 Facilities in 3 States $750 Million, 10-year Agreement to Service Over 650 Facilities in 11 States $180 Million, 10-Year Agreement to Service 19 Facilities in 6 States $210 Million, 10-Year Agreement to Service 100 Facilities in 27 States $583 Million, 10-Year Agreement to Service Over 50 Facilities in 8 States $150 Million, 10-Year Agreement to Service 19 Facilities in 11 States $180 Million Upsell with Advanced Glass Fiber Yarn for 10 Years
Enron Broadband Services Enron Intelligent Network BandwidthIntermediation ContentServices Deploy the Most Open, Efficient Network with Broad Connectivity Be the World’s Largest Provider of Premium Broadband Delivery Services Be the World’sLargest Buyer andSeller of Bandwidth Fiber Servers Pooling Points Network Control Broadband Content Management & Delivery Data Management Services Bandwidth Marketing & Trading ComprehensiveBandwidthManagement
EnronOnlineExtending Enron’s Products to the Internet Free, Reliable Transaction System with Enron as Principal Fully Integrated into Enron’sEstablished Risk Managementand Logistic Processes Utilizing Site to Offer Energy-Related Auction Capabilities Expands Enron’s Information Base and Market Knowledge “Tried and Tested” Platform for Expanding Enron’s eCommerce Activity Gross Transaction Value Transactions Through 8/30: 271,000 $131 Billion
Enron–Accelerating Market Development Metals Bandwidth Commodity Product Financial Australian Power & Gas Pulp & Paper Coal Weather Scandinavian Power & Gas Plastics Emissions Financials (interest rate, equity) UK Power & Gas Electricity Currencies Natural Gas 1985 1986 1987 1988 1989 1990 1991 1992 1993 1994 1995 1996 1997 1998 1999 2000 * Lighter shading indicates a developing market Darker shading indicates a mature market
Market Making Establishes Liquidity Define Product Standards and Contracts Obtain Access to Physical Product Develop Physical Distribution Innovative Structured Products Risk Management Enron is Neutrally Positioned to Make Commodity Markets Work Market Making Capabilities Operating Capabilities Other Capabilities eCommerce Platforms Risk Management Process Capital Cash Markets Forward Markets Futures Markets Transactions Logistics Settlement
Electricity–More Important Than Ever “The Internet consumed 8 percent of U.S. electric output in 1998, and is responsible for 40 percent of the U.S. load growth over the last 10 years.” -Robert Nardelli, CEO, GE Power Systems “The [demand] battlefield…is in data centers where thousands of servers and other powerful computers are stacked floor to ceiling. A single data center will use as much electricity as six 40-story office buildings. Roughly 20 data centers are currently planned for the Chicago area.” -Fortune (August 14, 2000)
U.S. Peak Electricity Demand Growth in Gigawatts 625 593 63 GW 562 200 All Others 172 191 SERC 157 149 147 ERCOT 55 51 47 WSCC 113 110 104 100 92 ECAR 92 1995 1997 1999 Peak electricity demand has increased 11% since 1995 Source: Cambridge Energy Research Associates
Key U.S. Electricity Facts Peak demand up by 11% since 1995 Reserve margins down by 14% since 1997 Transmission Loading Reliefs (TLRs) up by 300%
Transmission Loading Relief (TLR) Level 2-6 Incidents 1998-Present 1998 1999 2000 Source: NERC
California Electricity Imbalance 1996-99 11,000 MW 12% Increase 5,500 MW 1% Increase 672 MW Peak Demand Increase Powerplant Capacity Additions Proposed Capacity Backlog Source: CPUC; Electricity Oversight Board
Increasing Price Volatility in the Southern California Power Market 19% peak Capacity Margin $ per MWH Capacity Margin % 7% present Top Price Quartile Bottom Price Quartile
Circle of Strife Shortages Regulated Shortages Less Supply More Demand Price Spikes Brownouts Blackouts Blackouts Price Caps