Download
1 / 30
300 likes | 408 Vues
Navy Medicine FY11 Enterprise Spend Analysis & Strategic Sourcing. Presented by: Bert Hovermale Lead Contracting Executive (LCE) BUMED / Director Acquisition Management, NAVMEDLOGCOM & Jeremy Toton (CTR) ReefPoint Group Senior Acquisition and Logistics Analyst NAVMEDLOGCOM.

E N D
Navy Medicine FY11 Enterprise Spend Analysis & Strategic Sourcing Presented by: Bert Hovermale Lead Contracting Executive (LCE) BUMED / Director Acquisition Management, NAVMEDLOGCOM & Jeremy Toton (CTR) ReefPoint Group Senior Acquisition and Logistics Analyst NAVMEDLOGCOM
Bottom-Line Up-Front (BLUF) • NMLC has been conducting an annual spend analysis for four (4) consecutive years. • This compilation of data is pulled from two (2) disparate systems: • Federal Procurement Data System (FPDS) • Data feed from Standard Procurement System (SPS) • Defense Medical Logistics Standard Support (DMLSS) • Overall we want to see a continued movement of doing more inside DMLSS thru E-Commerce and less inside SPS (which we call direct contracting). • E-commerce = Prime Vendor Pharmacy + Prime Vendor Med Surg + ECAT • We want more of an emphasis placed on better commodity management and less fragmentation…meaning limiting multiple contracting offices purchasing the same FOR OFFICIAL USE ONLY
BSO-18 Total Funding for Equipment/Supplies/Services Spending Trend FY09-11 • Comment: • E-Commerce and Sourcing Optimization are critical to Navy Medicine Success! • Success = E-Commerce – 40-45% / Direct Contracting – 50-55 % / P-Card – 5% • As the overall spend grew by a net of $42M from FY10 to FY11… • $119M (25% growth) came in the form of E-Commerce…Great!!! • Direct Contracting saw a 5.3% decrease Total FY09 Spend = $2.27B Total FY10 Spend = $2.29B Total FY11 Spend = $2.33B
Navy Medicine Region Spend Trend FY10 -FY11 FY10 FY11 NCA Total by $86M * Decrease linked to shift from Navy UIC to JTF UIC NME Total by $70M NMW
BSO-18 Total Funded vs Contracted The pace of growth for the APF is outpacing that of our investment in material and services…indicating a growth in things such as CIVPERS (in-sourcing), Travel, Training, Support Agreements, etc. With continued focus on sourcing optimization and E-commerce this gap will close…allowing Navy Medicine to manage more of their own workload * APF data source – SMART ** Inclusive of DMLSS Spend
Navy Medicine Commodity Direct Contracting Spend Significant decrease in Healthcare providers in NMW Support Services (Medical and Non-Medical) continue to rise each year
Breakdown of Direct Contracting Support FOR Navy Medicine – All Commodities • Continues to be a strong reliance on FLC and Army for contracting support • Want to continue to see FLC support decrease and NAVMEDLOGCOM / MEDCEN/MTF/CLINICs % of support continue to increase
Breakdown of Direct Contracting Support FOR Navy Medicine – Med vs Non-Med Non-Medical Commodities NAVFAC on left axis…All Others on right axis Medical Commodities NAVMEDLOGCOM on left axis…MEDCEN/MTF/Clinics, Army, FLCs on right axis
Medical Commodities Direct Contracting Support FY11 Too Fragmented “lack of consistency = lack of control” All of FLC support for Med Maintenance should shift to Navy Medicine Goal is to shift more of this to NAVMEDLOGCOM
Non-Medical Commodities Direct Contracting Support FY11 Great examples of commodity management Too Fragmented “lack of consistency = lack of control” Air Force supported a $5M ADP requirement for Bethesda in FY11
Breakdown of Navy Medicine Total DMLSS Spend FY09 – FY11 • E-Commerce and Sourcing Optimization initiatives are working!!! • GPC increased by $8M…most notably in NME Prime Vendor - Pharmacy on left axis…All Others on right axis
Total Navy Medicine De-Obligations De-Obligations have increased exponentially over the last four (4) years…they represent an indicator for improved contract administration!!!
We are trending in the wrong direction! • This data represents real risk to Navy Medicine! • There are very specific approvals and processes that must be documented in order to utilize Non-DOD contracting Offices • Contact Navy Medicine’s POC at FLC Norfolk Det. Philadelphia (Ms Leanne Hanger (leanne.hanger@navy.mil) to develop a transition plan for these type requirements
Take Aways • Strategic Sourcing, E-Commerce, and Sourcing Optimization initiatives are working…as they continue to develop, we should see a consistent decrease in the # of unique Contracting Offices used within each commodity. • i.e., less fragmentation and more process control • Commands must continue to focus on shifting their GCPC and open market procurements into the E-Commerce mechanisms within DMLSS (Prime Vendor Pharm / Prime Vendor Med Surg / ECAT) • In effort to reinforce supply chain efficiencies, OSD has decremented each of the Services Medical Commands budget by over $250M spread across the next five (5) years (Navy Medicine’s portion of that decrement is $25M). • De-Obligations are a measure of successful contract administration…better planning and contract administration will allow for Navy Medicine to make better use of de-obligated funds still available for use in the future! • Sending our Non-Medical requirements to our Non-Navy Medicine partners is a good thing…but sending our requirements outside of DoD is against regulations (example: Department of Interior’s GovWorks)…unless those requirements have been properly vetted and documented by the appropriate authorities. • Violating these regulations puts Navy Medicine at risk of losing procurement authority. In addition, these actions illustrate Navy Medicine’s lack of control over regulated processes…again, placing us at risk of failing our clean audit assessment in 2013!
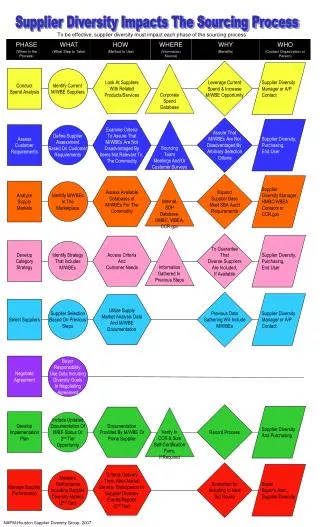
SOURCING SEMANTICS • Sourcing Optimization • Obtaining maximum value from DLA eCommerce solutions like Prime Vendor and ECAT by decreasing inappropriate utilization of the Government Purchase Card and eliminating unnecessary direct contracting • Strategic Sourcing • Replacing fragmented buying with centralized commodity management through demand aggregation and vendor consolidation in order to achieve savings, purchasing efficiencies, and standardization
MEDICAL EQUIPMENT MAINTENANCE Commodity Statistics: • The most highly fragmented commodity in Navy Medicine contracting • >95% of the spend for medical equipment maintenance occurs at the local MTF level…despite the fact that the most maintenance intensive medical equipment in our MTFs are procured by NMLC • Initial high-level analysis indicates Navy Medicine could save >$8M annually and streamline over 1,600 individual purchase orders. Where we are going: Limited commodity management success so far • Some OEM-specific requirements being processed through DLA Troop Support • Need to balance interests • Support to the BMET community • Current contracting realities
ORTHOPEDIC IMPLANTS – A HYBRID STORY • Strategic sourcing initiative led by M81 with a strategic optimization execution plan • Multiple awards with primary and secondary vendors in each of five major categories: Hips/Knees, Spine, Ortho Trauma, Instruments, Sports Medicine • Surgeons identified for each major category with Specialty Leader involvement • Plan of action: • Issue single solicitation but award by major category • Turn negotiated contracts over to DLA-Troop Support to become ECAT-enabled • Leverage these contracts to get additional vendors and additional discounts in ECAT
STRATEGIC SOURCING OF SERVICES • Medical support services buying is highly fragmented • Appointment clerks, records clerks in particular • FLC Norfolk/Philadelphia office will test SEAPORT-O Global Business Solutions (GBS) contracts as a possible vehicle to consolidate vendors • Effort is in need of a sponsor to facilitate requirements definition/development and demand management
NME Activity Funding Trend FY08-11 • $51M of the $87M increase was linked to increases in Healthcare Providers • E-Commerce grew by near $20M…(Great Job) • Remaining growth came from Non-Medical Commodities (Facilities / IT Equip & Maintenance / Logistics Support) • NH CL saw a decrease in Healthcare Providers by $12M…but also an increase in E-Commerce by $6M • NH Jax’s growth is linked to significant increases in IT support and Facilities…overall decrease of ECAT by 16% • Each activity’s minimal increases in spend are attributed to: • Minor decreases in Healthcare Providers • Increases in Facilities • Minimal (if any in some cases) increases in E-Commerce • NH Beaufort did double their ECAT spend…but also increased their P-Card spend from $670K to $3M Pretty Stable and Predictable…makes for easier Acq Planning!
NME Region Commodity Spend • Noteworthy Comments: • The net $20M increase in Healthcare Providers doesn’t tell the story: • NMC Portsmouth increased from $96M to $147M • Nurses went up by $20M / Radiologists rose $7M / Dentists up $11M • NH Camp Lejeunedecreased from $58M to $45M • All other NME MTF Healthcare Provider requirements shrunk $4-6M • The $16M decrease in Medical Equip & Supplies was tied mostly to NME Region HQ spend shrinking from $12M to $1.5M • There were significant funding increases from FY10 to FY11 in Facility Construction & Maintenance at every NME MTF…most notable: • Portsmouth went up by $8M / Beaufort rose $5M / Jax up $4M • The non-med support services spike is linked to IT/ADP/Telcom services • The $10M decrease in Non-Medical Equip & Supplies was tied mostly to NME Region spend shrinking from $8M to $980K • Despite increases at every MTF for facilities…there were decreases in Logistics Support Services at almost every MTF…mostly minor (>$1M) • Medical Equipment Maintenance declined significantly at Portsmouth, Jax, Pensacola and Camp Lejeune
NME DMLSS Spend Comparison FY09-FY11 GCPC ECAT PRIME VENDOR – MedSurg PRIME VENDOR – Pharmacy
NMW Activity Funding Trend FY08-11 Saw a decrease of $20M in Healthcare Providers Pretty Stable and Predictable…makes for easier Acq Planning!
NMW Region Commodity Direct Contracting Spend • Noteworthy Comments: • The net $11M decrease in Healthcare Providers doesn’t tell the story: • Camp Pendleton decreased from $39.5M to 17.5M • NHC Hawaii increased from $10.8M to $15M • NH Bremerton increased from $9.8M to $14M • All other FY11 NMW Healthcare Provider requirements were the same as FY10 (within +/- 1%) • NMW investment in Med Equip & Supplies have been consistent • Facility projects at NMC San Diego, NH Bremerton, and NH Yokosuka caused the $22M increase from FY10 to FY11 • Non-Med Equip and Non-Med Support Services remain consistent • Logistics Support Services continue to shift pretty drastically year to year • FY10-11 $6M increase was at NMC San Diego • Near $15M spike in FY09 was linked to one requirement for custodial janitorial services awarded by NAVFAC Northwest for NH Bremerton • $2.4M increase for Med Support Services was due to new investment for Naval Center For Combat and Operational Stress Control (NCCOSC)
Breakdown of Direct Contracting Support FOR NMW – All Commodities • Continues to be a strong reliance on NAVFAC, FLC and Army for NMW contracting support • Navy Medicine (NMW MTFs and NMLC) account for over 70% (on Avg) of total contracting support for region
NMNCA Region Spend Trend FY09-11 Bethesda on left axis…Quantico/Pax River/Annapolis/JTF CAPMED on right axis * - NNMC Bethesda’s totals include the DMLSS spend for Quantico, Pax River, and Annapolis
NMNCA Region Commodity Spend Nursing Services alone dropped from $47M to $9M Investment in ADP/Telcom Services more than doubled Investment in ADP/Telcom equipment went from $800k to $8M • $3M increase in Comms Installation • 2M increase in Office Machine maintenance • $1.5M increase for elevator maintenance
Breakdown of Direct Contracting Support FOR NMNCA – Medical Commodities Based on current guidance, the Army’s % of supporting NMNCA should continue to rise and NMLC’s should continue to shrink