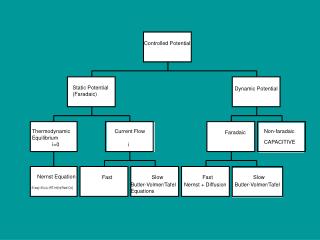
Nernst Equation
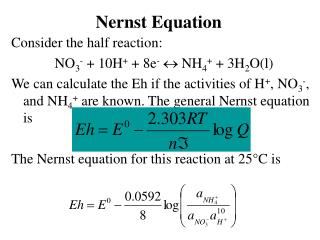
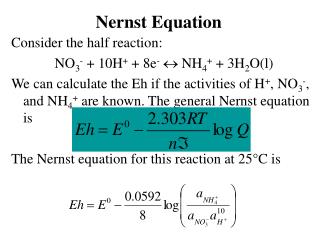
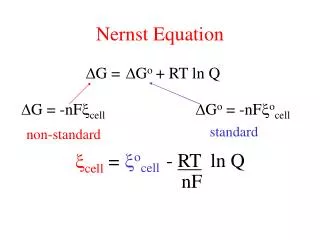
Nernst Equation. Consider the half reaction: NO 3 - + 10H + + 8e - NH 4 + + 3H 2 O(l) We can calculate the Eh if the activities of H + , NO 3 - , and NH 4 + are known. The general Nernst equation is The Nernst equation for this reaction at 25°C is.

Nernst Equation
E N D
Presentation Transcript
Nernst Equation Consider the half reaction: NO3- + 10H+ + 8e- NH4+ + 3H2O(l) We can calculate the Eh if the activities of H+, NO3-, and NH4+ are known. The general Nernst equation is The Nernst equation for this reaction at 25°C is
Let’s assume that the concentrations of NO3- and NH4+ have been measured to be 10-5 M and 310-7 M, respectively, and pH = 5. What are the Eh and pe of this water? First, we must make use of the relationship For the reaction of interest rG° = 3(-237.1) + (-79.4) - (-110.8) = -679.9 kJ mol-1
The Nernst equation now becomes substituting the known concentrations (neglecting activity coefficients) and
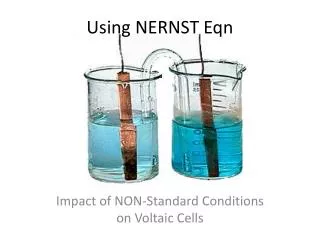
Biology’s view upside down? Reaction directions for 2 different redox couples brought together?? More negative potential reductant // More positive potential oxidant Example – O2/H2O vs. Fe3+/Fe2+ O2 oxidizes Fe2+ is spontaneous!
Stability Limits of Water • H2O 2 H+ + ½ O2(g) + 2e- Using the Nernst Equation: • Must assign 1 value to plot in x-y space (PO2) • Then define a line in pH – Eh space
UPPER STABILITY LIMIT OF WATER (Eh-pH) To determine the upper limit on an Eh-pH diagram, we start with the same reaction 1/2O2(g) + 2e- + 2H+ H2O but now we employ the Nernst eq.
As for the pe-pH diagram, we assume that pO2 = 1 atm. This results in This yields a line with slope of -0.0592.
LOWER STABILITY LIMIT OF WATER (Eh-pH) Starting with H+ + e- 1/2H2(g) we write the Nernst equation We set pH2 = 1 atm. Also, Gr° = 0, so E0 = 0. Thus, we have
O2/H2O C2HO
Making stability diagrams • For any reaction we wish to consider, we can write a mass action equation for that reaction • We make 2-axis diagrams to represent how several reactions change with respect to 2 variables (the axes) • Common examples: Eh-pH, PO2-pH, T-[x], [x]-[y], [x]/[y]-[z], etc
Construction of these diagrams • For selected reactions: Fe2+ + 2 H2O FeOOH + e- + 3 H+ How would we describe this reaction on a 2-D diagram? What would we need to define or assume?
How about: • Fe3+ + 2 H2O FeOOH(ferrihydrite) + 3 H+ Ksp=[H+]3/[Fe3+] log K=3 pH – log[Fe3+] How would one put this on an Eh-pH diagram, could it go into any other type of diagram (what other factors affect this equilibrium description???)
Redox titrations • Imagine an oxic water being reduced to become an anoxic water • We can change the Eh of a solution by adding reductant or oxidant just like we can change pH by adding an acid or base • Just as pK determined which conjugate acid-base pair would buffer pH, pe determines what redox pair will buffer Eh (and thus be reduced/oxidized themselves)
Redox titration II • Let’s modify a bjerrum plot to reflect pe changes

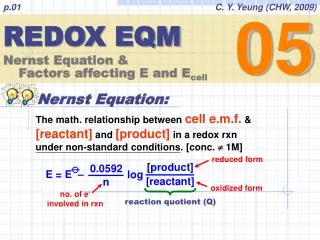
![The Nernst Equation [A ox ] + n [e - ] + m [H + ] [A red ]](https://cdn3.slideserve.com/6702907/slide1-dt.jpg)