Download
1 / 22
220 likes | 310 Vues
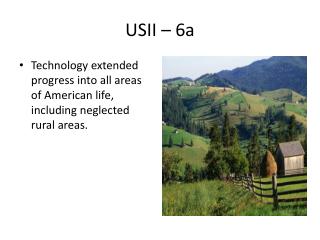
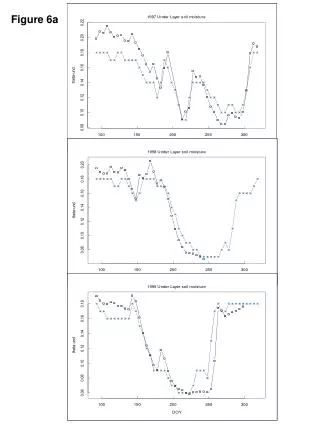
This study examines the relationship between Net Ecosystem Exchange (NEE) and Photosynthetically Active Radiation (PAR) in mid-summer models. Observations and predictions are compared for different scenarios.

E N D
Figure 16a 10 10 10 10 10 0 0 0 0 0 -10 -10 -10 -10 -10 -20 -20 -20 -20 -20 133 138 143 148 153 158 1992 1993 1994 NEE [umoleCO2/m2/s] 1995 1996 Day of Year
10 10 10 10 10 0 0 0 0 0 -10 -10 -10 -10 -10 -20 -20 -20 -20 -20 133 138 143 148 153 158 Fig 16b 1997 1998 1990 NEE [umoleCO2/m2/s] 2000 2001 Day of Year
Figure 17a 10 10 10 10 10 -10 -10 -10 -10 -10 -30 -30 -30 -30 -30 168 173 178 183 188 193 1992 1993 1994 NEE [umoleCO2/m2/s] 1995 1996 Day of Year
Figure 17b 10 -10 -30 10 -10 -30 10 -10 -30 10 -10 -30 10 -10 -30 168 173 178 183 188 193 1997 1998 1999 NEE [umoleCO2/m2/s] 2000 2001 Day of Year
Figure 18a 10 10 10 10 10 5 5 5 5 5 0 0 0 0 0 8 13 18 23 28 33 1992 1993 1994 NEE [umoleCO2/m2/s] 1995 1996 Day of Year
Figure 18b 10 10 10 10 10 5 5 5 5 5 0 0 0 0 0 8 13 18 23 28 33 1997 1998 1999 NEE [umoleCO2/m2/s] 2000 2001 Day of Year
6 6 6 6 6 2 2 2 2 2 0 0 0 0 0 -2 -2 -2 -2 -2 -6 -6 -6 -6 -6 300 350 50 100 150 200 250 Fig 22a 1992 1993 NEE [umoleCO2/m2/s] 1994 1995 1996 Day of Year
Fig 22b 6 6 6 6 6 2 2 2 2 2 0 0 0 0 0 -2 -2 -2 -2 -2 -6 -6 -6 -6 -6 300 350 50 100 150 200 250 1997 1998 NEE [umoleCO2/m2/s] 1999 2000 2001 Day of Year
1999 Mid-summer NEE obs, Model-0/C 5 obs M0 0 M0C -5 NEE [umoleCO2/m2/s] -10 -15 5 10 15 20 hour 1999 NEE vs. PAR - Mid-summer hourly means 5 obs 19 M0C 6 18 0 17 -5 NEE [umoleco2/m2/s] 7 16 15 -10 14 8 13 -15 9 12 11 10 0 200 400 600 800 1000 1200 FIGURE 26a PAR
1994 Mid-summer NEE obs, Model-0/C 1994 NEE vs. PAR - Mid-summer hourly means 5 5 obs obs 19 M0 M0C 0 M0C 0 6 18 -5 NEE [umoleCO2/m2/s] 7 -5 NEE [umoleco2/m2/s] 17 -10 -10 8 16 15 -15 -15 9 10 13 14 11 12 -20 5 10 15 20 0 200 400 600 800 1000 1200 hour PAR FIGURE 26b
observed Model-I 1999 NEE vs. PAR - Mid-summer hourly means 5 19 6 18 0 17 -5 7 16 NEE [umoleco2/m2/s] -10 15 14 8 13 -15 9 12 11 10 -20 0 200 400 600 800 1000 1200 PAR Figure 30a 1999 Mid-summer NEE (observed & predicted) 5 observed Model-0 0 Model-I -5 NEE [umoleCO2/m2/s] -10 -15 5 10 15 20 hour Figure 30a. (top) 1999 Mid-summer observed, Model-0, and Model-I hourly mean NEE. (bottom) 1999 Mid-summer observed and Model-I hourly mean NEE vs hourly mean PAR.
1994 Mid-summer NEE (observed & predicted) 5 observed Model-0 0 Model-I -5 NEE [umoleCO2/m2/s] -10 -15 5 10 15 20 hour 1994 NEE vs. PAR - Mid-summer hourly means 5 observed 19 Model-I 0 6 18 7 -5 17 NEE [umoleco2/m2/s] -10 8 16 15 -15 9 10 13 14 11 12 -20 0 200 400 600 800 1000 1200 PAR Figure 30b Figure 30b. (top) 1994 Mid-summer observed, Model-0, and Model-I hourly mean NEE. (bottom) 1994 Mid-summer observed and Model-I hourly mean NEE vs hourly mean PAR.