Download
1 / 22
220 likes | 346 Vues
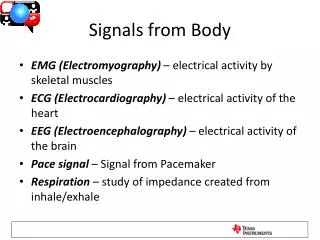
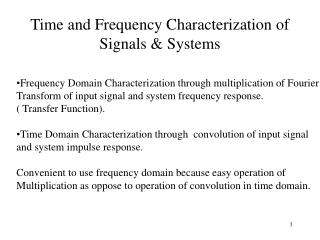
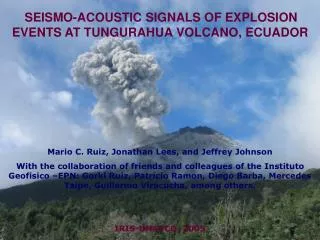
Characterization of explosion signals from Tungurahua Volcano, Ecuador. David Fee and Milton Garces Infrasound Laboratory Univ. of Hawaii, Manoa dfee@isla.hawaii.edu Robin Matoza Laboratory for Atmospheric Acoustics (L2A) Scripps Institution of Oceanography. Overview. Tungurahua Volcano

E N D
Characterization of explosion signals from Tungurahua Volcano, Ecuador David Fee and Milton Garces Infrasound Laboratory Univ. of Hawaii, Manoa dfee@isla.hawaii.edu Robin Matoza Laboratory for Atmospheric Acoustics (L2A) Scripps Institution of Oceanography
Overview • Tungurahua Volcano • Array(s) • Explosion Algorithm and Events • Examples • March 2007 Sequence • May 2006 • Explosions Source • Cross-Correlation • Conclusions
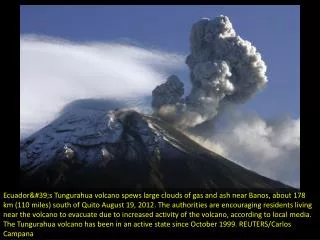
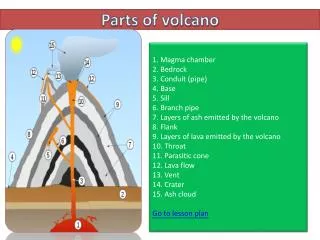
Tungurahua Volcano • 5023 m high, 3200 m of relief • Frequent eruptions characterized by pyroclastic flows, lavas, lahars, as well as tephra falls • Over 30,000 people live in close proximity, evacuated in 1999 • Significant ash ejections resulting from nearly constant tremor and explosions • Motivation: • Understand dynamics and evolution of explosions • Aid general understanding and monitoring Images Courtesy Instituto Geofisico
ASHE Arrays - RIOE • 4 Element Array, ~100 m aperture • Chaparral 2 Microphones • Flat between 0.1-200 Hz • Collocated BB seismometer • Porous hoses in open field • Recorded signals from Tungurahua and Sangay Volcanoes 37 km 33° 43 km 132°
Explosion Detection Algorithm • Time period: 2/15/06-11/1/2007 • High-pass filter data >.5 Hz • STA/LTA event onset and end time • 2/5 secs, 3/40 secs • Detection must be on all 4 channels • Run PMCC between 0.5-4 Hz • 10 bands, 10 sec windows • Families with correct azimuth (±7°) during event time • Minimum RMS amplitude >0.02 Pa RMS • Minimum family size >15 pixels
4/1/06 4/1/06 7/1/06 7/1/06 10/1/06 10/1/06 1/1/07 1/1/07 4/1/07 4/1/07 7/1/06 7/1/06 10/1/06 10/1/06 Amplitude and Number Events • 9331 Events detected • >400 per day during peak • Events clumped during periods of high activity • Amplitudes: 0 .018-24.4 Pa Mean = 0.64 Pa • Durations: 0.1-16.5 s Mean = 3.95 s
Acoustic Source Energy • EAcoustic=2πr2/ρc ∫ΔP(t)2dt r=source-receiver distance ρ=air density C=sound speed ΔP=change in pressure • Energy normalized by reference event • Removes geometric spreading and topographical effects • Reference Event: 1.30x10⁷ J • Assume spherical spreading • More energy more eruptive material?
4/1/06 4/1/06 7/1/06 7/1/06 10/1/06 10/1/06 1/1/07 1/1/07 4/1/07 4/1/07 7/1/06 7/1/06 10/1/06 10/1/06 Energy Release • Energy ratios: 7.5x10⁻⁵-502 Mean = 0.81 Largest explosions follow 7/14/06 VEI 3 Eruption • Group eruptive activity: • Background tremor • May 06 • July 14-15th, 2006 • August 16-17th, 2006 • March 07
4/1/06 7/1/06 10/1/06 1/1/07 4/1/07 7/1/06 10/1/06 Effective Yield • Convert Explosion Energies to Effective Yield • 1 ton of TNT = 4.184 GJ • Largest explosion=1.56 ton, most around .001 ton (~1 kg of TNT) • Volcanic explosion in fluid, relationship may not hold
March 2007 Sequence - Example • Moderate-High Activity resumed between 2/15-4/15 • Significant number of explosions and associated ash • Seismic Tremor and LPs returned 2/23/07 • Significant number of explosions starting 2/24
February 24th Event • 2/24/07 • Impulsive Onset • Signal lasts ~5 mins • Sustained amplitude ~± 1 Pa • Ash >40’000 ft • Jetting? Similar spectrum
Acoustic Source Energy Example Explosion: 3/8/07 0745 UTC ~10 Pa at 36.89 km 368,900 Pa at 1 m 205 dB (re 20 μPa)! Effective Yield: 0.115 ton (105 kg) TNT
March 2007 Explosion Energy • Most energetic explosions during middle of sequence • Cloudy weather hampered visual monitoring for much of sequence • Energy and number of explosions correlate well with heightened volcanic activity
Observation vs. Recording: April 4th, 2007 • Good recording and viewing conditions. Selected day for eyewitness, satellite, infrasound correlations • Observation: 0450 UTC Explosion. Vibration of windows in Banos (7 km) and heard at observatory (13 km). Clear weather and constant emission reaching 8.5 km asl (~28,000 ft) • Infrasound: 2007-04-04 04:51:03, 2.91 Pa, 6.4 sec, 1.571 energy ratio
Explosions Infrasonic Harmonic Tremor • Mid-May 06: Explosions trigger gliding harmonics lasting up to 30 mins • Very little ash during these explosions/tremor • New Injection of Magma?
Explosions Seismic Harmonic Tremor • Band-limited sustained seismic tremor • Similar frequencies, but harmonics not very apparent (low SNR as well)
Explosion Source • Ruiz et al. 2005: analyzed travel times of seismic and acoustic first arrivals (ΔT =Tacoustic-Tseismic) • Large variations in ΔT source location variability? • Concluded explosions events originate <200m, followed by outflux of gas, ash, and solid material ~1 s later • May 06 Explosions similar to acoustic recordings from Arenal Volcano, Costa Rica (Garces et al., 98) • Explosion in low sound speed, low density magma-gas mixture would couple better into the atmosphere acoustic impedance match • Then decompression front propagates into conduit and create resonance • Substantial pressure perturbation could destabilize the melt and initiate flow • Explosion near surface of a gas-rich conduit creates a resonance that transmits into the atmosphere and couples into earth through the conduit walls
2006/7/31 Explosion ~300 m Infrared Video 0.1 0 -0.1 • Somewhat emergent onset, relatively low amplitude • Long duration • Liquid magma ejected
Cross-Correlation • Pick “master” waveform for subset of events • Cross-correlation for each event • Look at evolution of correlation value? • Parameters: 0.1-5 Hz, Window: -3 s, +8 s from onset, amplitude >.5 Pa Test Master Waveform
Cross-Correlation Results • Subset data between 5/11-5/16 2006 • 385 Explosions • Waveforms very similar on 5/14 Master
Cross-Correlation – Families • 37 km away so atmosphere effects may affect waveform similarity • Possible solution: compare waveforms with similar atmospheric conditions • Use 0.02-.1 Hz as a proxy for wind speed (Fee and Garces, 2007) • Sort explosions by waveform similarities (Green and Neuberg, 2006; Umakoshi et al., 2003) 5/11 Waveform Family 5/14 Waveform Family
Conclusions • Significant number of high s/n explosions recorded from Tungurahua Volcano • Similarities and differences exist: amplitude, duration, energy, correlation, ash content, harmonics • Other data sources necessary to understand effect of explosions • Some ash rich, some ash poor • Understanding explosions key to hazard monitoring and dynamics at Tungurahua • Future Work • Correlate explosions with observed activity: ash, pyroclastic flows, incandescent blocks • Waveform cross-correlation by families: group by correlation and similar atmospheric conditions • Model acoustic/seismic explosion source and determine how it relates to tremor