Lecture Outline 3
160 likes | 340 Vues
Lecture Outline 3. Measures of Central Tendency Please note: Not all slides/material from the lectures are included here. This presents only a detailed outline of the lecture. Measures of Central Tendency. Three main types Mode Median Mean Choice depends upon level of measurement.

Lecture Outline 3
E N D
Presentation Transcript
Lecture Outline 3 Measures of Central Tendency Please note: Not all slides/material from the lectures are included here. This presents only a detailed outline of the lecture.
Measures of Central Tendency • Three main types • Mode • Median • Mean • Choice depends upon level of measurement
The Mode • The mode is the most frequently occurring value in a distribution. • Abbreviated as Mo • EX: 20, 21, 30, 20, 22, 20, 21, 20 (Mo?) • Sometimes there is more than one mode • EX: 96, 91, 96, 90, 93, 90, 96, 90 • Bimodal • Mode is the only measure of central tendency appropriate for nominal-level variables
The Median Position of the Mdn • The median is the middle case of a distribution • Abbreviated as Mdn • Appropriate for ordinal or interval level data • How to find the median? • If even, there will be two middle cases – interpolate • If odd, choose the middle-most case • Cases must be ordered • Multiple identical values in the middle • – Numerical value becomes the median
What is the median? odd or even? (7+1)/2=4th case Where is the 4th case? Sort distribution from lowest to highest 1 5 2 9 13 11 4 Example of median: Years in Marriage Position of the Mdn
4th case? 5 years=Mdn Interpretation? 1 2 4 5* 9 11 13 Example of median: Years in Marriage
What is the median? (8+1)/2=4.5 Half way between the 4th and 5th case Mdn=2.5 2.5 years Interpretation? 1 1 2 2 3 4 4 6 Example of median with 8 cases Position of the Mdn
The Mean • The mean is appropriate for interval and ratio level variables X = raw scores in a set of scores N = total number of scores in a set
Mdn Mo Step-by-step Illustration: Mode, Median, and Mean Suppose that a volunteer contacts friends on campus collecting for a local charity. She receives the following donations (in Liras): 5 10 25 15 18 2 5 Step 1: Arrange the scores from highest to lowest. Step 2: Find the most frequent score. Mo = 5 Step 3: Find the middlemost score. Mdn = 10 25 18 15 10 5 5 2
Step-by-step Illustration: Mode, Median, and Mean Step 4: Determine the sum of scores. Step 5: Determine the mean by dividing the sum by the number of scores. 25 18 15 10 5 5 2 ∑X = 80
Comparing the Mode, Median, and Mean • Three factors in choosing a measure of central tendency • Level of measurement • Shape or form of the distribution of data • Research Objective
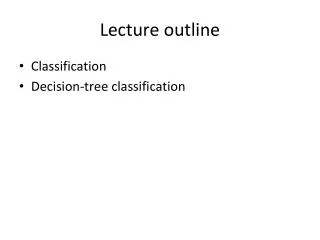
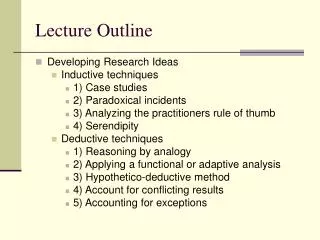
Shape of the Distribution • In symmetrical distribution – mode, median, and mean have identical values • In skewed data, the measures of central tendency are different • Skewness relevant only at the interval level • Mean heavily influenced by extreme outliers • median best measure in this situation
Research Objective • Choice of reported central tendency depends on the level of precision required. • Most published research requires median and/or mean calculations. • In skewed data, report mean and median together to understand where the skew is.
Figure 1 This figure shows the relative positions of the mean and median for right-skewed, symmetric, and left-skewed distributions. Note that the mean is pulled in the direction of skewness, that is, in the direction of the extreme observations. For a right-skewed distribution, the mean is greater than the median; for a symmetric distribution, the mean and the median are equal; and, for a left-skewed distribution, the mean is less than the median.