The Structure of the Web: Graph Theory and Measures of Node Importance
Learn how the web is structured using graph theory, and explore important measures of node centrality such as degree, betweenness, closeness, and eigenvector centrality. Discover the PageRank algorithm and its impact on search engine rankings.

The Structure of the Web: Graph Theory and Measures of Node Importance
E N D
Presentation Transcript
Web Graph Web Infrastructure/Web Architecture COMP 3220/6218 Heather Packer – hp3@ecs.soton.ac.uk 20/11/18
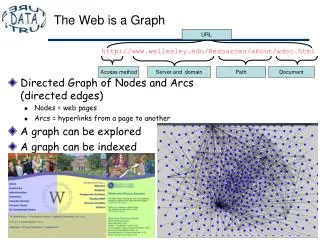
How is the Web Structured? hyperlink
How is the Web Structured? Graph Theory: Pages are nodes & links are directed edges
Graphs can Model • The Web • Facebook users • Tweets • Publications • Bitcoin/Block chain transactions
Graph Theory – Useful Measures • A graph is made from Nodes or Vertices (V) and Edges (E) G = (V, E) • Network size, total number of vertices (N) • Distance between two vertices (v and v’) • Diameter of a graph, longest distance between any two vertices • Average-case diameter, average distance between any pair of nodes (v and v’) • Degree of a vertex, number of edges connected to it • Density of network, ratio of edges to vertices
Which is the Most Important Node? P L Q M N I O J H K D G A E B F C
Graph Theory – Is this Node Important? • Importance measures using centrality: • Degree centrality • Betweenness centrality • Nearness centrality • Eigenvector centrality • *Central as in important, vital or `at the heart of’, not near the centre
Which is the Most Important Node? P Eigenvector L Q M N Degree I O Closeness J H K D G A E Betweenness B F C
Degree Centrality • Degree centrality focuses on individual nodes – it simply counts the number of edges that a node has • Hub nodes with high degree usually play an important role in a network F B deg(E)=5 G C A E deg(A)=4 H D I J
Degree Centrality – In Degree • In degree – links to a vertex • Often used as a proxy for popularity • A web page is important if lots of things link to it • A twitter user is important if lots of other users follow it • A journal article is important if lots of other articles cite it F B inDeg(E)=4 G C A E H D I J
Degree Centrality – Out Degree • Out degree – links from this vertex • Authorities on a topic F B inDeg(E)=4 G C A E outDeg(E)=1 H D I J
Degree Distributions • Degree distributions p(k) • A plot showing the degree of nodes in a graph F B 1 1 G C A E 5 4 1 1 Number of Nodes H D 1 1 I Number of links J 2 1
Degree Distribution Examples • Normal distribution • The average degree is most likely • Very high and very low degrees are highly unlikely • Power law distribution • No meaningful average degree • Very low degrees are likely, but very high degrees are unlikely
Power Law Networks • Some nodes have a tremendous number of connections to other nodes (hubs) • Most nodes have just a handful of links • Robust against accidental failures, but vulnerable to coordinated attacks • Nodes can have millions of links: The network appears to have no scale (no limit) hubs
Betweenness Centrality • Number of shortest paths going through a node • A node that has high betweenness is vital to the communication of the network • Many/most messages between two nodes must travel through it. E B A D F C
Betweenness Centrality • Betweeness Centrality for A • B to D • B to E • B to F • C to D • C to E • C to F • BC(A) = 6 E B A D F C
Closeness Centrality • Closeness is the average of the shortest distances to all other nodes in the graph • The farness of a vertex with respect to a graph is the sum of its distances to every other vertex in the graph • The closeness of a vertex is the inverse of its farness E B 1 ms 1 ms 1 ms A D 3 ms 2ms 1 ms F C
Closeness Centrality • Closeness centrality of A • A to B = 1 ms • A to C = 1 ms • A to D = 1 ms • A to E = 2 ms • A to F = 3 ms • CC(A) = 1.6 ms E B 1 ms 1 ms 1 ms A D 3 ms 2ms 1 ms F C
Eigenvector Centrality • Eigenvector measures the popularity by looking at the quality of links • Identifies whether a node is connected to influential nodes • PageRank is an example F B G C A E H D I J
What do the Measures Tell Me? • Degree: exposure to the network, opportunity to directly influence • Betweenness: informal power, gate keeping, brokering, controls flow of browsing • Closeness: estimates time to receive information, indirect influence, point of rapid diffusion • Eigenvector: connected to influential nodes of high degree, “not what you know but who you know”
Google’s PageRank Algorithm • Number of links • Pages with more in links rank higher, than a page fewer in links • Link Quality • A link from an important page is worth more than many links from relatively unknown sites • Link Context • The text in and around out links relates to the page they point at. • Ranking boosts on text styles
PageRank: Original Formula • PageRank (PR) of page u is given by the summation of the PR of all pages in the set of all pages linking to page u(v∈Bu), divided by the number of L(v) of links from page v • Iterative formula, starting with rank 1/n for all n pages
PageRank: Surfer Model • Usage simulation • Based on a model of a Web surfer who follows links and makes occasional haphazard jumps • User randomly navigates • Jumps to random page with probability p • Follows a random hyperlink with probability 1-p • Never goes back to a previously visited page
Google and PageRank • PageRank was the first ranking algorithm and most well known • Today PageRank is not the only algorithm used • PageRank score used to be available through the browser • PageRank can and was gamified
What Does the Web Look Like? • Experimental Observations [Barabasi, Albert (1999)] • Sparse graph • Power law • Small world network • The Shape of the Web [Broder et al (2000)] • 2005 what the web looks like
Small World Network • Six Degrees of Separation is a theory that everyone is 6 or fewer steps away from any other person in the world • Experiment by Stanley Milgram in the 1960 • 300 letters • Sent to intermediary person on a first name basis • 64 made it • Average hops of 5.2 intermediaries
Small World Network • Small World Network is a graph which most nodes are not neighbours but most nodes can be reached by a small number of connections • Website links • Social networks • Wikipedia • Many hubs – pages with many in links • Robust for random node deletions
Experimental Methodology • Intuition: Networks grow by iterative process • Simulate growing a network and then examine its properties • Experiment with different models • For example: Preferential attachment means that the more connected a node is, the more likely it is to receive new links • This can lead to the power law distribution • Eg:Links on the web or Citations to scientific papers
What does the Web look like? • Experimental Observations [Barabasi, Albert (1999)] • Sparse graph (n vertices, mn edges) • Small world network • Power law • The Shape of the Web [Broder et al (2000)] • The Opte Project 2003
The Bow Tie • Strongly Connected Components • In links • Out links • Tendrils and Tubes
Web Graph Results • The diameter of the central core (SCC) is at least 28, and the diameter of the graph as a whole is over 500 • The probablity of a path between randomly chosen pairs is only 24% • Average directed path length is about 16 • Average undirected path length is about 6
What does the Web look like? • Experimental Observations [Barabasi, Albert (1999)] • Sparse graph (n vertices, mn edges) • Small world network • Power law • The Shape of the Web [Broder et al (2000)] • The Opte Project 2003
Modern Web Research • Temporal aspects – how is the Web Graph evolving over time? • Information aspects – how does new information propagate throughout the web (or blogosphere, or twitter, ...) • Finer-grained structure – how to define and compute “communities” in information and social networks
Summary • The Web can be modeled as graph • Importance Measures • Page Rank • What the Web looks like at scale