Download
1 / 35
350 likes | 379 Vues
This chapter focuses on the importance of plant nutrient uptake, the factors that govern it, and how it affects nutrient use efficiency. It also explores the role of mycorrhizae in nutrient uptake and compares it to N-fixing mutualisms. The chapter delves into the mechanisms through which nutrients enter roots and the cost-benefit dynamics of nutrient associations. Additionally, it discusses nutrient stoichiometry, the Redfield ratio, and the influence of nutrient limitation on plant responses.

E N D
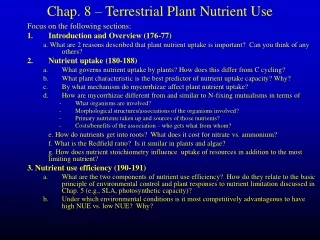
Chap. 8 – Terrestrial Plant Nutrient Use Focus on the following sections: • Introduction and Overview (176-77) a. What are 2 reasons described that plant nutrient uptake is important? Can you think of any others? • Nutrient uptake (180-188) • What governs nutrient uptake by plants? How does this differ from C cycling? • What plant characteristic is the best predictor of nutrient uptake capacity? Why? • By what mechanism do mycorrhizae affect plant nutrient uptake? • How are mycorrhizae different from and similar to N-fixing mutualisms in terms of • What organisms are involved? • Morphological structures/associations of the organisms involved? • Primary nutrients taken up and sources of those nutrients? • Costs/benefits of the association – who gets what from whom? e. How do nutrients get into roots? What does it cost for nitrate vs. ammonium? f. What is the Redfield ratio? Is it similar in plants and algae? g. How does nutrient stoichiometry influence uptake of resources in addition to the most limiting nutrient? 3. Nutrient use efficiency (190-191) • What are the two components of nutrient use efficiency? How do they relate to the basic principle of environmental control and plant responses to nutrient limitation discussed in Chap. 5 (e.g., SLA, photosynthetic capacity)? • Under which environmental conditions is it most competitively advantageous to have high NUE vs. low NUE? Why?
Trophic Interactions and Secondary Production Reading: CMM Chap. 11 A. Food webs 1. Food chains 2. Food chains vs. food webs 3. Linked webs B. Energy budget 1. Energy loss 2. Ecological pyramids C. Ecological efficiency of energy transfer 1. The arithmetic 2. Controls on Trophic Efficiencies a. Consumption b. Assimilation c. Production D. Ecosystem consequences 1. Food chain length 2. Top-down vs. bottom-up control of production 3. Herbivory effects on nutrient cycling
Where does the energy come from that fuels ecosystems? What is the fate of that energy? How does it affect the distribution and abundance of organisms of different types? What are the controls on heterotrophic production?
A. Food webs • Food chains a. Primary trophic levels - Primary producers, herbivores, carnivores (predators), omnivores, detritivores b. linear connections between trophic levels. c. Both detrital and grazing food chains.
2. Food chains vs. food webs • Food webs: • Nonlinear • Omnivory blurs trophic levels
Simplified food web Most food webs are oversimplified- can quantify effects by interaction strengths.- only strongest interactions are often shown- interaction strengths can vary with environmentTop down vs. bottom-up control? Molles 2004
Most food webs are oversimplified- Analysis of food webs, usefulness for determining species interactions, depends on level of resolution.
3. Linked food webs Grazing and detrital chains are linked
B. Energy Budget: Source and fate of energy (Molles 2004)
B.1. Fate of energy Points: 1. Energy flow is one-way - once used, it is dissipated as heat 2. GPP > NPP > NEP
B.2. Trophic pyramids Rule of thumb: 10% energy transfer between trophic levels Classic food chain
Trophic energy losses: a Michigan old-field Very little NPP becomes animal biomass
Biomass at each trophic level carnivores herbivores 1o producers Inverted trophic pyramids Can this ever happen with pyramids based on energy flow (productivity)?
Inefficiencies of food chains result in energy pyramids 11.8
C. Ecological Efficiencies of energy transfer Why is biomass of animals so small? Where does all the energy go? Why is transfer efficiency so low?
Production Respiration Assim. Feces Consumed Assimilated Urine Consumed Unconsumed 1o Prod So, P = C - R - F - U C.1. The Arithmetic Availability of energy for growth
Production Respiration Assim. Feces Consumed Assimilated Urine Consumed Unconsumed 1o Prod Trophic efficiency = In/Pn-1 * An/In * Pn/An = Pn/Pn-1 Production efficiency = Pn/An Availability of energy for growth: Depends on efficiency of transfer Assimilation efficiency = An/In Consumption efficiency = In/Pn-1
C. 2.Controls on trophic efficiencies a. Consumption efficiency Table 11.1. Consumption efficiency of the herbivore trophic level in selected ecosystem types.
Consumption vs. NPP Food quality Differences among biomes
Factors governing consumption efficiency • 1. Plant quality • Depends on resource supply and species • Plant allocation to structure • Plant defense (p. 248-249) • Herbivores vs. carnivores
Factors governing consumption efficiency 1. Plant quality 2. Activity budget of animal • Selection of habitat • Time spent eating • Animals do many other things (avoid predators, reproduction, etc.) • Selectivity of plants and plant parts
Factors governing consumption efficiency • 1. Plant quality • 2. Activity budget of animal • 3. Abundance of consumers relative to producers
b. Assimilation Efficiency Assimilation, production, and growth efficiencies for homeotherms and poikilotherms Smith (1998) Table 11.3, p. 181, See also CMM Table 11.2
Assimilation efficiency depends on: • Food quality • (e.g., summer vs. winter diet of hares) • Physiology of consumer • homeotherm vs. heterotherm (warmer, more constant gut temperature)
c. Production efficiency (Pn/An) Table 11.2 Depends mainly on the metabolism of the animal (homeotherm vs. heterotherm)
D. Ecosystem consequences Secondary Production vs. NPP 1. Food chain length
Greater production can lead to more trophic levels. Molles 2004
But, NPP is not the only constraint on animal production 11.3 - Control of predation, disease, supplemental water, supplemental minerals in managed ecosystems.
Bottom-line: no simple correlation across ecosystems in NPP and food chain length • Other factors (environmental variability, habitat structure) can be strong. • Excess nutrients/production can change community composition to dominance by well-defended species (e.g., aquatic systems).
2. Trophic cascades • Odd numbers – green world, even numbers – bare
Simplified food web Trophic cascades • Depend on strong interactions among a few dominant species • Tough to use in management – predicting species interactions is difficult!
3. Herbivory effects on N cycling Herbivory magnifies effects of differences in soil fertility on decomposition and mineralization
Summary • Interaction strengths tell who is eating who and how much. • Grazing and detrital food webs interact. • Energy loss at each trophic transfer. • Consumption, assimilation, and production efficiencies determine amount of new biomass at each level. • Trophic cascades only with comparatively simple ecosystems.
Molles fig.18.16 Molles fig.18.17 Molles fig.17.4 Molles fig.17.2