
Mastering Statistics and Research Methods: Detecting Deception
E N D
Presentation Transcript
Statistics and Research Methods How to lie, sway, and mislead using statistics
When confronted with any type of data, ask yourself… • who is included in the sample? ► Science – uses random sampling ► Pseudoscience – biased selection • how large is the sample? ► Science – >100 if lab, >1K if other ► Pseudoscience – N=1, anecdotal
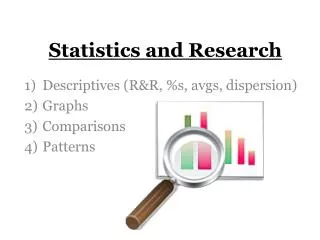
When confronted with any type of data, ask yourself… • what data is being presented? ► Science – presents all data ► Pseudoscience – only biased • how is the data presented? ► Science – graphing standards ► Pseudoscience – graphs can lie!
Mean, Median, Mode • 1994 Baseball strike about salary: • Owners argued: typical salary is $1.2 Million • Players argued: typically salary is $415,000 • Which measure of central tendency was each side using?
When confronted with any type of data, ask yourself… • is this correlation or causation? ► To understand the difference between correlation and causation, we first need to understand how the data is collected…
Correlations Correlation coefficients range from –1.0 to +1.0 Sign indicates direction ( positive +, or negative - ) Number refers to the strength of the relationship ( higher = stronger )
Correlation v. Causation Depressed Mood Cause? Impaired Sleep Depressed Mood Impaired Sleep Cause? Depressed Mood Impaired Sleep Cause? Cause? Family Conflict
Apply what we have learned • Quizzes taken from Learning Module - http://www.psych.ualberta.ca/~ITL/ct/ • Does watching violent TV make children aggressive? • How would you conduct a correlational study testing this research question? • How would you conduct an experimental study testing this research questions?
Correlational? or Causational? • A newspaper headline reads, Heavy Drinkers Get Lower College Grades. • Your psychology textbook states that some people remember concrete words better than abstract words. • People who were abused as children are more likely than others to become child abusers • A health magazine reports that depressed people who continue medication for at least six months are less likely to relapse than people who take medication for less than six months
Writing Exercise #2 • Horoscope experiment