Analyzing Global Population: Patterns, Trends, and Developments
Explore global demographic trends and the impact on social and economic development from the past to projections for 2045. Understand carrying capacity, population growth, migration, and dependency load. Uncover insights from population pyramids and the Demographic Transition Model using helpful terms and examples.

Analyzing Global Population: Patterns, Trends, and Developments
E N D
Presentation Transcript
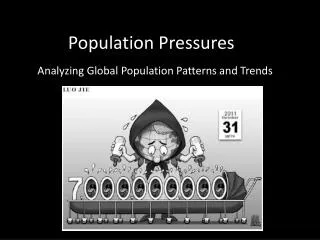
Population Pressures Analyzing Global Population Patterns and Trends
100 People A world portrait • What does this portrait tell us about: • Global demographic patterns? • Social development? • Economic development? http://www.cbc.ca/strombo/world/infographic-if-the-world-was-100-people.html
7 Billion • Revisit the short National Geographic clip in your group and answer the following questions: • What was the world’s population in 1800? 1960? What factors might account for this explosion? • What is the population projection for 2045? • What does this video reveal about the distribution of Earth’s resources?
Carrying Capacity Carrying Capacity: • If everyone in the world lived like the average Canadian, we would need 4.5 planet earths!
Carrying Capacity and Technology • CC is not a fixed number – Varies from 2.2 billion to 40 billion. Why? • Vastly different levels of resource consumption • Depends on stage of society. More advanced = larger CC STAGE 1: Hunting and Gathering STAGE 2: Agricultural Revolution STAGE 3: Industrial RevolutionSTAGE 4: Technological Revolution?
Key Terms Revisited • Demography: the study of human populations • Birth Rate: is the number of births per 1000 people in a country • Birth Rate = (Births ÷ Population) x 1000 • Death Rate: is the number of deaths per 1000 people in a country • Death Rate = (Deaths ÷ Population) x 1000 • Infant Mortality Rate: is the number of children who die in their first year of life for every 1000 live births in a country • Infant Mortality Rate = (Infant death ÷ Total Live Births) x 1000 • Natural Increase Rate: the rate at which a population increases or decreases per year based ONLY on the death rate and birth rate – does not account for immigration • Natural Increase Rate = (Births – Deaths) ÷ Total Population x 100
Population Growth Rate • Population Growth Rate: rate at which a population increases or decreases in a given year through natural increase and net migration • Population Growth Rate = Natural increase rate + Net Migration Rate • Canada’s Population Growth Rate is 1.1%, India’s is 1.3%, Japan’s -0.1%
Immigration/Emigration: • What’s the difference? • Immigration is entering a foreign country • Emigration is leaving one country for another • Net Migration is the difference between the number of immigrants coming in and emigrants leaving an area in a period of time • Displayed as ppl per 1,000 inhabitants • A positive value represents more people entering the country than leaving it, while a negative value mean more people leaving than entering it
Emigration and Immigration • Emigration Rate (Emigrants ÷ Total Population) x 1000 • Immigration Rate: (Immigrants ÷ Total Population) x 1000 • Net Migration Rate = (Immigrants – Emigrants) ÷ Total Population x 1000
Dependants • Dependency Load is defined as the number of people in a population that are under 15 or over 65 • Often people >15 or <65 dependent on the rest of the population economically • Dependency Load = (Population under 15 + Population over 65) ÷ Total Population x 100
Global Patterns and Trends Work with a partner and complete the questions using the links and Online sources: • Identify the top 10 most populated countries in 2013. What are the population projections for these countries in 2050? 2a) Examine a map online regarding population density. Considering your answer for #1, what geo-spatial patterns do you notice about global population growth? b) What factors might account for high levels of growth? Low levels of growth? 3. Examine the data from the US Population Bureau. Calculate the population increase (in raw numbers) from 2012 to the projections for 2050 for the top 5 countries.
DENSITIES • Arithmetic density: The total number of people / area of land (measured in km2 or sq miles). • Physiological density: The total population / area of arable land. • Agricultural density: The total rural population / area of arable land
Global Patterns and Trends 4a. Using the World Bank data, identify the region of the world that has the highest levels of population growth. b. Does this finding surprise you? Why or why not? 5. Which regions have the lowest levels of growth? What might explain this pattern?
Population Pyramids 3 Main Types * Expansive * Declining (constrictive) * Stable/Near Stationary UN Projections
FIND It! • Which countries are in each of the DTM stages?