ROOT: A Data Mining Tool from CERN
Learn about ROOT, a free and open-source data analysis framework. Explore its features for data visualization, simulation, fitting, and more. Discover how ROOT efficiently handles large data volumes. Dive into examples, tools, and benefits for optimal data modeling and analysis.
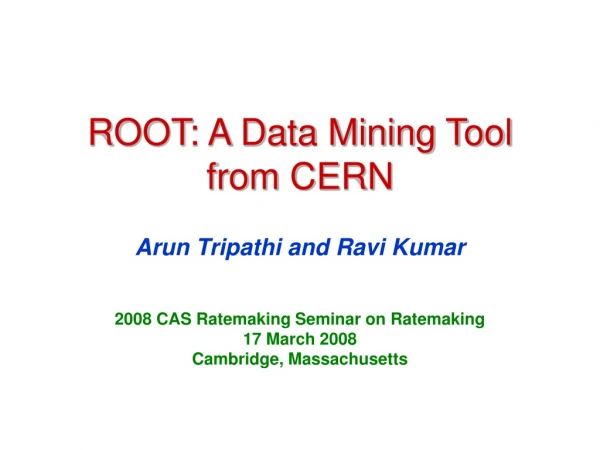

ROOT: A Data Mining Tool from CERN
E N D
Presentation Transcript
ROOT: A Data Mining Tool from CERN Arun Tripathi and Ravi Kumar 2008 CAS Ratemaking Seminar on Ratemaking 17 March 2008 Cambridge, Massachusetts
Outline • What is ROOT ? • Why ROOT ? • Some useful features of ROOT • Data visualization • Data simulation • Data fitting • Demos
What is ROOT ? • An object oriented data analysis framework in C++, developed at CERN. • CERN is a particle physics lab located near Geneva, Switzerland. • Particle physics experiments produce vast amounts of very complex data. • Thousands of terabytes every year. • Handling and analyzing such data volumes efficiently is a major challenge. • ROOT project was started at CERN in 1995 to address this challenge. • The LHC project at CERN is a $8 Billion, international project. • ROOT is the tool being used to analyze data from LHC. • Several other scientific projects around the globe use ROOT. • So? What do physics solutions have to do with the “real world”?
From Physics to “Real World”: An Example • The World Wide Web (the web) was invented at the same lab, CERN, in 1990. Below are some excerpts from the world’s first website.
So, What is ROOT ? • An object oriented data analysis framework in C++, developed at CERN. • Specifically designed to handle, store, and analyze large amounts of datavery efficiently. • Allows both highly interactive and batch mode analysis of data. • Data visualization and exploration tools. • Statistical modeling tools. • High quality graphics • Networking • Parallel processing. • It is free, open-source and dynamically extensible. • Users can write and use their own classes with ROOT. • Several operating systems are supported, including Windows, Linux, Unix, and Mac OS X.
Data Storage and Access in ROOT • ROOT stores data in a Tree format, with branches and leaves. • Can store complex objects, arrays, images, in addition to simple data types. • Optimized for reduced disk usage and increased access speed. An Example: • In this case, ROOT file takes only 18% space compared to the corresponding ASCII text file. • See the demos for access speed.
Importance of Data Visualization Some Data: Some Statistics About this Data: • What do these numbers tell us about the data ? • What is the relationship between Y and X ?? • Maybe I should do a regression analysis ?
Same Data in a “picture” • A linear regression of Y vs X would certainly give the wrong answer. • Looking at this graphs gives us a good idea of the functional relationship between Y and X.
Same Data in a “picture” • Hmm...! Looks like Y has a sinusoidal dependence on X. Y = sin(X) A picture is worth a thousand numbers ! Really!! • Data visualization is a crucial step in optimalmodeling of data. • ROOT provides convenient graphic tools to visualize and explore even large data sets.
Some Visualization Tools in ROOT • Histograms • 1, 2 and 3 dimensional histograms. • Profile histograms. • Graphic interface for fitting the distributions. • Easy visualization of any arbitrary function in 1, 2 and 3 dimensions. • Graphs • Pie charts. • etc....
Some Statistical Tools in ROOT • Multiple regression. • Maximum likelihood fitting. • ROOT comes with general purpose function minimisers. • They can be used to fit any user defined function to the data. • One can use either least-squares, or maximum likelihood method. • Neural Networks. • Function approximation using basis functions. • Linear Algebra • Principal components analysis. • Numerous mathematical functions. • Fourier transforms. • Random number generators and simulation tools. • etc..
More Machine Learning: TMVA • TMVA = Toolkit for Multivariate Analysis • http://tmva.sourceforge.net/ • TMVA comes as a part of the standard ROOT installation. • TMVA can be used to identify the predictive power of variables. • Several classification algorithms available in TMVA, including: • Multidimensional k-NN classifier. • Linear discriminant analysis. • Function discriminant analysis. • Neural Networks. • Boosted/Bagged decision trees. • Rules based predictive learning (RuleFit) • Support Vector Machine.
Some other relevant features • Connectivity to external databases via ODBC. • CINT – the C interpreter • CINT interprets C/C++ code. • Allows fast prototyping of the analysis. • High quality graphics, including: • Animation • Image-processing. • Three dimensional graphics. • Extensive self-contained GUI toolkit • Can create Customized user interfaces. • Networking and parallel processing.
Summary • ROOT is a free, open-source data analysis and data mining tool from CERN (where the Web was invented). • Specifically designed to handle, store and analyze large amounts of data very efficiently. • Allows for serious data analysis even on a laptop PC. • Comes with: • Numerous statistical, mathematical and data mining tools. • Excellent data exploration/visualization tools. • Interfaces for convenient interaction with data. • Complete GUI development toolkit. • CINT – the C-interpreter. • Connectivity with external databases. • Suitable for any environment requiring serious and scalable data analysis, modeling and reporting.
Some Demos • The tree viewer. • Fast data access. • Histograms: • 1D, 2D, 3D and Profile. • Fitting the distributions. • Interior design. • Saving the graphics. • Regression • Neural Network