Download
1 / 33
340 likes | 391 Vues
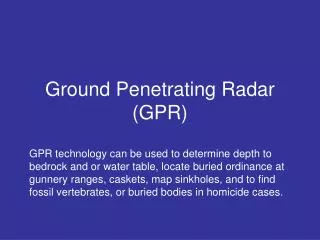
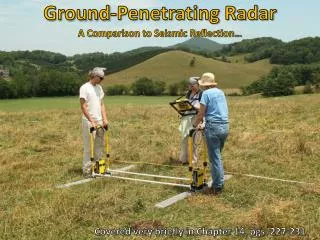
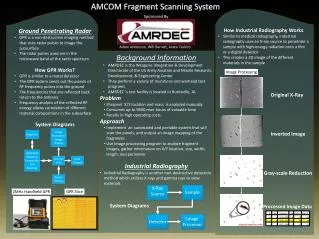
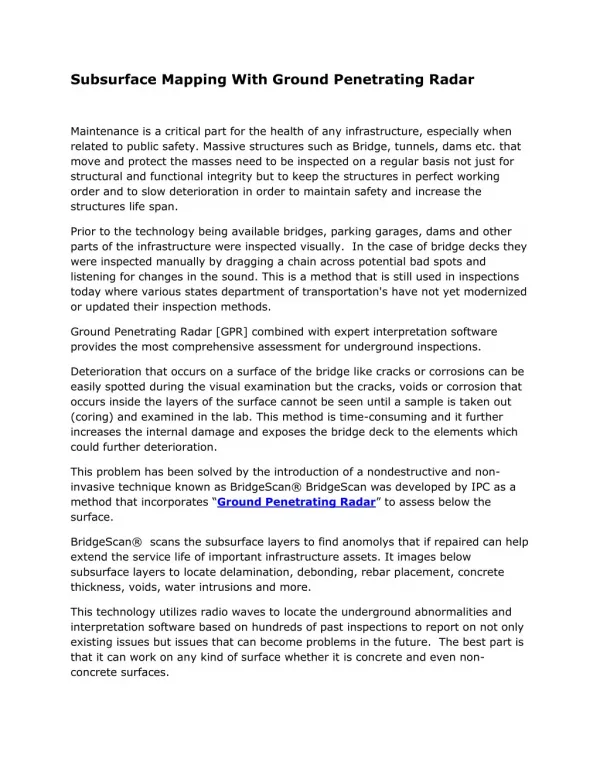
Ground-Penetrating Radar uses radio waves to image subsurface structures, displaying data similar to seismic sections. It operates based on electrical properties of soil, controlling velocity, attenuation, and reflection. While effective in certain materials like dry soil and concrete, GPR has limitations in highly conductive surfaces. The method relies on contrasts in dielectric permittivity for reflections, with resolution and depth depending on frequency. Data acquisition involves moving antennas to transmit and receive radar waves for practical applications in various fields like glaciology, geology, and archaeology. The technology has also been utilized in polar and planetary applications, such as aboard the Mars Reconnaissance Orbiter.

E N D
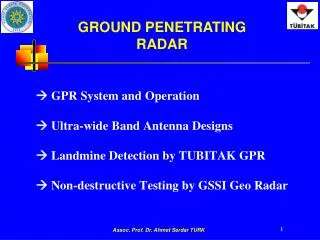
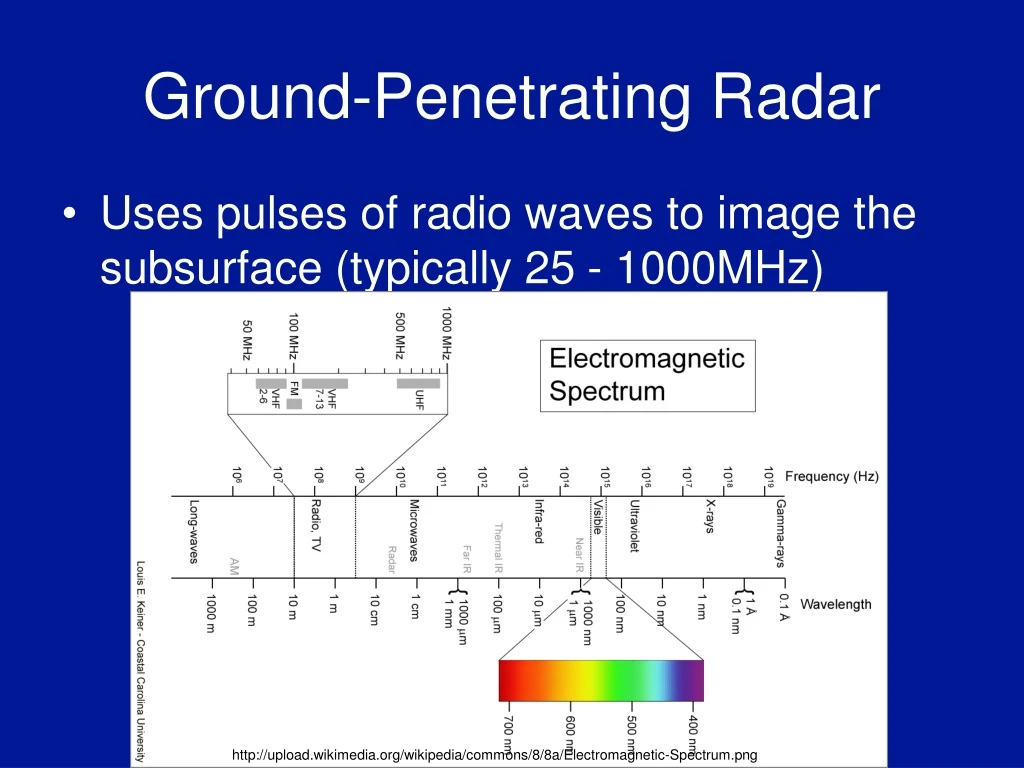
Ground-Penetrating Radar • Uses pulses of radio waves to image the subsurface (typically 25 - 1000MHz) http://upload.wikimedia.org/wikipedia/commons/8/8a/Electromagnetic-Spectrum.png
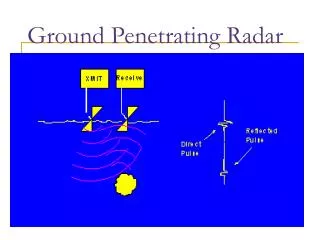
GPR uses Radio Waves to Image the Subsurface Survey Mode – Reflection Survey
GPR and Seismic Reflection • Displaying GPR data (left) is analogous to a reflection seismic section (right) Figures 8.13 and 4.48 in Burger, Sheehan, and Jones, 2006
EM Wave Properties Characteristics of radar waves • Velocity -- v • Attenuation -- • Reflection coefficient -- R Are controlled by the electrical properties of the soil: • Dielectric Permittivity -- K • Conductivity -- 𝞂
Radar Velocity • In a vacuum: velocity is the speed of light ( c ) • In materials: • Relative dielectric permittivity ( K ) • Relative magnetic permeability(𝝻) • Normally 1 for geological materials V = c /(𝝻 K)1/2 ~ c/√K
Radar Attenuation • Radar attenuation controls how quickly the radar energy is absorbed by the medium • High attenuation results in poor soil or rock penetration • Attenuation is proportional to conductivity and inversely proportional to dielectric permittivity at 100 MHz 𝜶 = 1.7 x 10³ 𝞂 / √K
Common Material Electrical Properties @ 100 MHz Conductivity Attenuation Velocity Material K v 𝞂a (m/ns) (mS/m) (dB/m) Air 1 0.30 0 Distilled Water 80 0.0330.01 2x10⁻³ Fresh Water 80 0.0330.5 0.1 Sea Water 80 0.01 3x10³ 103 Dry Sand 3-5 0.150.01 0.01 Saturated Sand 20-30 0.060.01-1 0.03-0.3 Limestone 4-8 0.120.5-2 0.4-1 Shales 5-15 0.091-100 1-100 Silts 5-30 0.071-100 1-100 Clays 5-40 0.082-1000 1-300 Granite 4-6 0.130.01-1 0.01-1 Dry Salt 5-6 0.130.01-1 0.01-1 Ice 3-4 0.160.01 0.01 Metal 1000000 ~0 ∞ ∞
GPR Limitations • Does not work well in presence of high surface conductivity (e.g. wet clays or conductive fluids) because of high attenuation. • The high attenuation prevents radar waves from penetrate into these materials • GPR does work well in regions of ice, snow, dry sandy soil, or over concrete.
Reflections are caused by Contrasts in Dielectric Permittivity Reflected Incident K1 K2 Transmitted K1- K2 R = K1+ K2
Resolution and Depth • Smallest resolvable layer is assumed to be of thickness ( λ/4 ) where ( V = f λ) • higher frequencies have higher resolution; however, they have small penetration depths • lower frequencies have lower resolution; however, they have large penetration depths
500 MHz 1000 MHz Antenna Center Frequency Typical Application Glaciology Geology Utility Locating 250 MHz Archaeology Forensics Roads Concrete
Frequency 12.5 50 100 200 25 Lower Frequency = longer wavelength = deeper penetration = less resolution Higher Frequency = shorter wavelength = less penetration = more resolution
Frequency vs. Depth Values are based on practical experience. Should only be used as a quick guide.
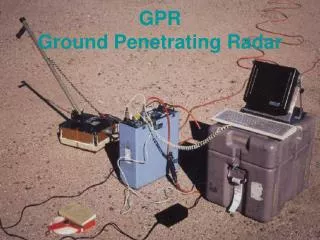
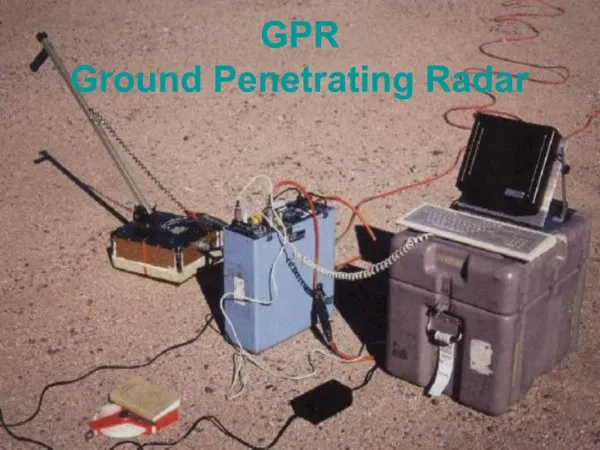
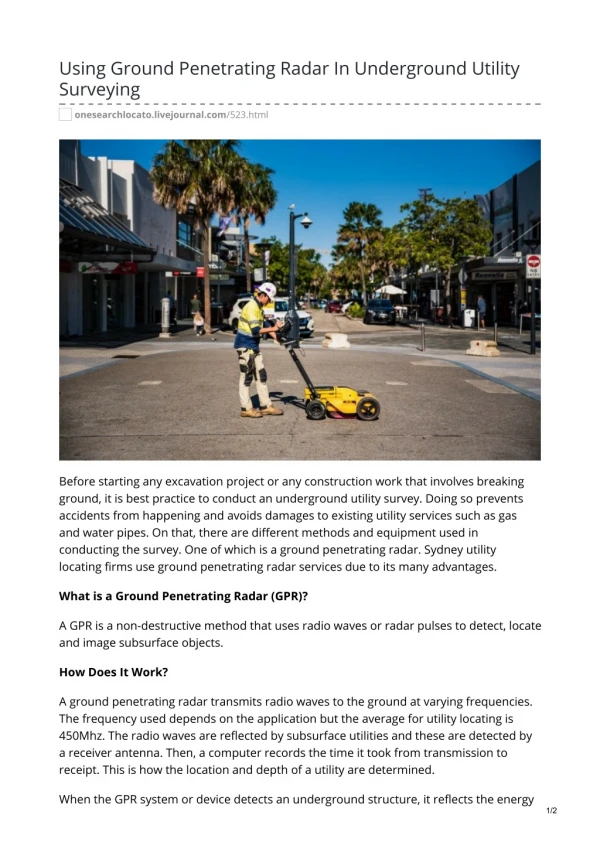
Data Acquisition • Data is collected by moving a transmitter and a receiver antenna over the area continuously broadcasting and receiving radar waves. The antenna are usually separated by a fixed distance and moved together. Figure 8.15 in Burger, Sheehan, and Jones, 2006
500 MHz 1000 MHz Antenna Center Frequency Typical Application Glaciology Geology Utility Locating 250 MHz Archaeology Forensics Roads Concrete
Applications • Historic cemetery in Alabama (yellow arrows are strong reflectors, red arrows are weak reflectors, and blue lines are bedrock interfaces http://upload.wikimedia.org/wikipedia/commons/9/9c/LINE21.jpg
Diffraction Hyperbola • Radar waves go out in all directions so the strongest reflections may not be directly below the radar antennas Figures 8.21 and 8.19 in Burger, Sheehan, and Jones, 2006
Velocity and depth can be extracted by matching the shape of a hyperbola in the data with an adjustable on-screen overlay of a hyperbola Velocity Calibration Method:Hyperbola Matching
Water Table One of the strongest reflecting horizons – large dielectric permittivity contrast K= 5 to K = 25
Planetary Applications • SHARAD (SHAllowRADar) aboard the Mars Reconnaissance Orbiter Spacecraft • 15 – 25 MHz • Hres = 0.3 - 3 km • Vres = 10 - 15 m http://www.nasa.gov/mission_pages/MRO/multimedia/1334-0-gram.html