Network Management Mechanisms: SNMP and CMIP/CMOT
170 likes | 205 Vues
Learn about the two major network management protocols, SNMP and CMIP/CMOT, and their mechanisms for retrieving, changing, and transporting network management data. Explore monitoring mechanisms and event notification for effective network management.

Network Management Mechanisms: SNMP and CMIP/CMOT
E N D
Presentation Transcript
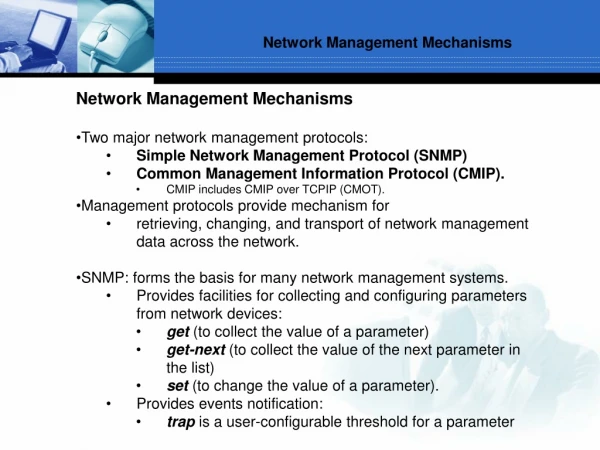
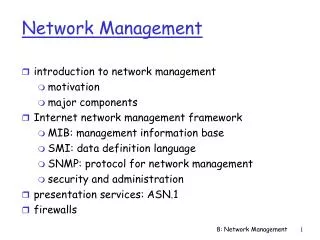
Network Management Mechanisms • Network Management Mechanisms • Two major network management protocols: • Simple Network Management Protocol (SNMP) • Common Management Information Protocol (CMIP). • CMIP includes CMIP over TCPIP (CMOT). • Management protocols provide mechanism for • retrieving, changing, and transport of network management data across the network. • SNMP: forms the basis for many network management systems. • Provides facilities for collecting and configuring parameters from network devices: • get (to collect the value of a parameter) • get-next (to collect the value of the next parameter in the list) • set (to change the value of a parameter). • Provides events notification: • trap is a user-configurable threshold for a parameter
Network Management Mechanisms • Network Management Mechanisms • SNMP parameters: • Management Information Bases (MIBs) • Based on a type of network device, technology, or protocol| • SNMPv3 provides • more secure authentication • ability to retrieve blocks of parameters • and trap generation for most parameters • Common Management Information Protocol CMIP/CMOT: • Allows for more types of operations. • CMIP/CMOT features: • globally unique object naming • object classification • alarm reporting • audit trails • test management • SNMP is simpler to configure and use than CMIP/CMOT
Monitoring Mechanisms • Monitoring Mechanisms • Obtaining values for end-to-end, per-link, and per-element characteristics. • The monitoring process involves: • collecting data about the desired characteristics • processing data • displaying processed data • archiving a subset of this data. • Data collection and processing, through polling: • ensure that the data are current and valid • data may or may not reflect the characteristics we wish to monitor • values may be derived from the gathered data • other values may be modified (e.g., added, subtracted, time-averaged) • This is processing of the data.
Monitoring Mechanisms • Monitoring Mechanisms • Sets of raw processed and unprocessed data will need to be displayed: • standard monitor displays, • field-of-view • wide-screen displays • and special-purpose displays. Along with • Techniques to display data: • logs and textual displays • graphs and charts (both static and moving) • alarms • by symbols (e.g. showing parts of the network as a cloud)
Monitoring Mechanisms • Saving data: • saved permanent or temporary • primary storage • network management server (short period of time) • secondary storage (archives) • aggregation of data from multiple primary storage sites • storage server for the network • tertiary storage (archives), (the most permanent, slowest) • all devices may combined on a single device.
Monitoring Mechanisms Monitoring Mechanisms
Monitoring Mechanisms • Monitoring for Event Notification • An event is something that occurs in the network that is noteworthy. Could be: • Problem • Failure • Events may be noted in: • Log file • Display • Alarming • Events are short-lived changes in the behavior of the network • Real-time analysis : setting thresholds or boundaries for short-term or immediate notification of events • Example: Ping is used to gather roundtrip delay information, which is presented as a chart on the monitoring system.
Monitoring Mechanisms • Monitoring for Event Notification • A threshold of 100 ms • Reaches 100ms alarming to notify the network manager that a problem may exist in the network. • Real-time analysis: • Requires short polling intervals • There is a trade-off between the number of characteristics and network devices polled for real-time analysis versus the amount of resources (capacity, CPU, memory, storage) needed to support such analysis.
Monitoring Mechanisms • Monitoring for Event Notification • Amount of network data generated by the periodic polling of multiple characteristics can impact the overall performance of the network. • For example: • a network with 100 network devices/elements (NE) • each element has 4 interfaces • each interface is monitored for 8 characteristics • (100 NE)∗(4 Interfaces)∗(8 char.) = 3200 char.
Monitoring Mechanisms • If each of the 3200 characteristics generates 8 bytes of data and an estimated 60 bytes of overhead • amount of data generated per polling: • (3200 char)∗(suppose polling interval = 5 seconds • 1.74 Mb of traffic would be spread out over the 5 seconds, or 384 Kb/second. • For a period of one day • amount of traffic (1.75 Mb)∗(720 polling intervals/hour)∗(24 hours/day) = 30.2 GB • amount of data stored (3200 characteristics/polling interval)∗(8 bytes)∗(720 polling intervals/day)∗(24 hours/day) = 442 MB data stored per day • Over one year = 161 GB of data 8 +60 Bytes) = 2176 KB of traffic, or 1.74 Mb of traffic
Monitoring Mechanisms • Monitoring for Trend Analysis and Planning • Trend analysis utilizes network management data to determine long-term network behaviors or trends. • This is helpful in planning for future network growth. • In doing continuous, uninterrupted data collection, usually with long polling intervals (minutes or hours instead of seconds), • Polls for each characteristic are saved to network management on a regular basis, and over a long period of time
Monitoring Mechanisms • Instrumentation Mechanisms • Instrumentation: the set of tools and utilities needed to monitor and probe the network for management data. • Mechanisms: include access to network management data via SNMP, monitoring tools, and direct access. • Instrumentation can be coupled with monitoring, display, processing. and storage to form a complete management system.
Monitoring Mechanisms • SNMP (currently in version 3) provides: • access to management information base (MIB) variables, including those in MIB-II, other standard MIBs (e.g., DS1 MIB), enterprise-specific MIBs, and other monitoring MIBs (remote monitoring (RMON), and switch monitoring (SMON). • Monitoring tools include utilities such as: • ping, Traceroute, and TCPdump, • while direct-access mechanisms include: • telnet, FTP, TFTP, and connections via a console port.
Monitoring Mechanisms • Configuration Mechanisms • Configuration is setting parameters in a network device for operation and control. • Configuration mechanisms include: • direct and remote access to devices and downloading configuration files (Figure 7.7): • SNMP set commands • Telnet and command line interface (CLI) access • Access via HTTP • Access via common object request broker architecture (CORBA) • Use of FTP/TFTP to download configuration files
