Download
1 / 48
490 likes | 512 Vues
Explore the origin, evolution, and various metrics of topography for detailed analysis and data preparation using LiDAR and photogrammetry techniques. Learn about terrain relief, roughness, and spectral analysis.

E N D
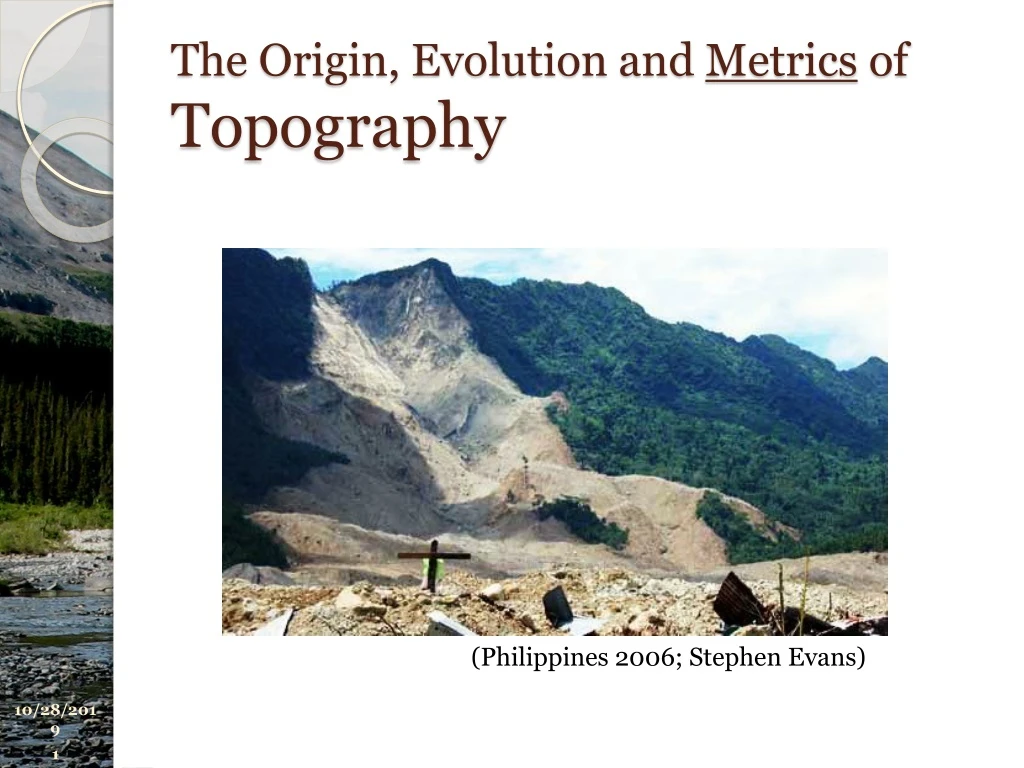
The Origin, Evolution and Metrics of Topography (Philippines 2006; Stephen Evans)
Metrics of Topography • Types of data • Points, Lines, Polygons • Raster data • Creating data • Ground survey (GPS, Total Station, Auto-Level and Stadia Rod) • Transition of legacy historic data (contours) through interpolation to DEMs • Photogrametery: stereo imagery translated to DEMs (airborne or satellite) • Structure from Motion: many oblique images used to create a point cloud • Ground Based or Airborne LiDAR • Preparing data for analysis • Filling holes • Smoothing • Accuracy assessment • Resources • http://gis4geomorphology.com/ • http://hydrology.usu.edu/taudem/taudem5/ • http://www.opentopography.org/
Best DEM for Chile? • ASTER Satellite • Collected global stereo imagery • Automated processing • V1, 2009; V2, 2011 • ~30m resolution • Limitations with mountains, clouds, ice • http://gdem.ersdac.jspacesystems.or.jp/search.jsp • http://asterweb.jpl.nasa.gov/gdem.asp
Ground Based LiDAR Airborne LiDAR
Metrics of Topography • Metrics • Length • Horizontal, Vertical and Slope distances • Area • Plan-view or surface area • Volume • Differences between two surfaces • Slope • Steepest Descent • Neighborhood averaging • Curvature • Issues with raw data analysis: Noise • Increasing smoothing simplifies surfaces
Metrics of Topography • Metrics • Length • Horizontal, Vertical and Slope distances • Area • Plan-view or surface area • Volume • Differences between two surfaces • Slope • Steepest Descent • Neighborhood averaging • Curvature • Issues with raw data analysis: Noise • Increasing smoothing simplifies surfaces
Metrics of Topography • Other Metrics • Relief • Roughness • Cross section • Longitudinal section • Swath Profile • Change detection • Subsurface topography • Spectral Analysis: • 2-dimensional Discrete Fourier Transform • Continuous Wavelet Analysis • Specifically, variations in spectral power within spatial frequency bands characteristic of deep-seated landslides allow us to efficiently produce accurate kilometer-scale, deep-seated landslide maps.
Metrics of Topography • Other Metrics • Relief • Roughness • Cross section • Longitudinal section • Swath Profile • Change detection • Subsurface topography • Spectral Analysis: • 2-dimensional Discrete Fourier Transform • Continuous Wavelet Analysis • Specifically, variations in spectral power within spatial frequency bands characteristic of deep-seated landslides allow us to efficiently produce accurate kilometer-scale, deep-seated landslide maps.
The functional relationship between erosion rate and topography is central to understanding both controls on global sediment flux and the potential for feedback between tectonics, climate, and erosion in shaping topography. • These analyses support the emerging view that erosion rates adjust to high rates of tectonically driven rock uplift primarily through changes in the frequency of landslidingrather than hillslope steepness, and imply that changes in local relief play a minor role in controlling landscape-scale erosion rates in tectonically active mountain ranges.
Montgomery and Brandon, 2002 Do hillslopes just get steeper as rock uplift rate (which drives erosion rate) increases?
Montgomery and Brandon, 2002 Tectonically Inactive Tectonically Active (compiledfrom Summer¢eld and Hulton [19] and Pazzagliaand Brandon [18], which include data updated from Ahnert [17]).
Metrics of Topography • Other Metrics • Relief • Roughness • Cross section • Longitudinal section • Swath Profile • Change detection • Subsurface topography • Spectral Analysis: • 2-dimensional Discrete Fourier Transform • Continuous Wavelet Analysis • Specifically, variations in spectral power within spatial frequency bands characteristic of deep-seated landslides allow us to efficiently produce accurate kilometer-scale, deep-seated landslide maps.
http://www.watershedsciences.com/about/news/automated-landslide-detectionhttp://www.watershedsciences.com/about/news/automated-landslide-detection
How do they do that? • WSI’s landslide detection relies on a detailed bare-earth DEM derived from a LiDAR ground model. Ground-classified LiDAR points are first processed to create a variety of raster images (≤ 1-meter cell size), which reveal different landform features unique to landslides and faults. These images are then used as inputs for a series of semi-automated classification steps. The various algorithms include a combination of: • iso-clustering, • principal component analysis, and • support vector machines, • which result in an initial landslide classification. http://www.watershedsciences.com/about/news/automated-landslide-detection
Metrics of Topography • Other Metrics • Relief • Roughness • Cross section • Longitudinal section • Swath Profile • Change detection • Subsurface topography • Spectral Analysis: • 2-dimensional Discrete Fourier Transform • Continuous Wavelet Analysis • Specifically, variations in spectral power within spatial frequency bands can characteristic of deep-seated landslides allow us to efficiently produce accurate kilometer-scale, deep-seated landslide maps.
Wavelet Requirements Wikipedia, 2013
Unfailed Terrain Failed Terrain
Fourier Transforms Continuous Wavlet Analysis
Relevant Timescales Korup et al, 2010
A very important website • http://blogs.agu.org/landslideblog/