Download
1 / 22
220 likes | 404 Vues
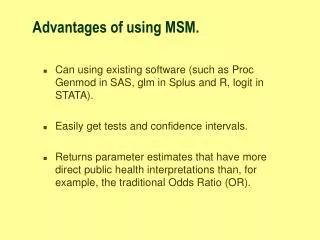
Advantages of using MSM. Can using existing software (such as Proc Genmod in SAS, glm in Splus and R, logit in STATA). Easily get tests and confidence intervals. Returns parameter estimates that have more direct public health interpretations than, for example, the traditional Odds Ratio (OR).

E N D
Advantages of using MSM. • Can using existing software (such as Proc Genmod in SAS, glm in Splus and R, logit in STATA). • Easily get tests and confidence intervals. • Returns parameter estimates that have more direct public health interpretations than, for example, the traditional Odds Ratio (OR).
Simple Example (A = Tx, Y = OutcomeL = Confounder) – all binary -> L = 0 | Y A | 0 1 | Total -----------+----------------------+---------- 0 | 10 40 | 50 | 20.00 80.00 | 100.00 -----------+----------------------+---------- 1 | 30 20 | 50 | 60.00 40.00 | 100.00 -----------+----------------------+---------- Total | 40 60 | 100 | 40.00 60.00 | 100.00 _______________________________________________________________________________ -> L = 1 | Y A | 0 1 | Total -----------+----------------------+---------- 0 | 16 24 | 40 | 40.00 60.00 | 100.00 -----------+----------------------+---------- 1 | 252 108 | 360 | 70.00 30.00 | 100.00 -----------+----------------------+---------- Total | 268 132 | 400 | 67.00 33.00 | 100.00
Crude association . cs Y A [freq=pop] | A | | Exposed Unexposed | Total -----------------+------------------------+---------- Cases | 128 64 | 192 Noncases | 282 26 | 308 -----------------+------------------------+---------- Total | 410 90 | 500 | | Risk | .3121951 .7111111 | .384 | | | Point estimate | [95% Conf. Interval] |------------------------+---------------------- Risk difference | -.398916 | -.5027443 -.2950877 Risk ratio | .4390244 | .3612844 .5334922 Prev. frac. ex. | .5609756 | .4665078 .6387156 Prev. frac. pop | .46 | +----------------------------------------------- chi2(1) = 49.65 Pr>chi2 = 0.0000
Getting estimate of P(A|L) and weights . logit A L [freq=pop] Logit estimates Number of obs = 500 LR chi2(1) = 72.70 Prob > chi2 = 0.0000 Log likelihood = -199.34791 Pseudo R2 = 0.1542 ------------------------------------------------------------------------------ A | Coef. Std. Err. z P>|z| [95% Conf. Interval] -------------+---------------------------------------------------------------- L | 2.197225 .2603417 8.44 0.000 1.686964 2.707485 _cons | 3.79e-16 .2 0.00 1.000 -.3919928 .3919928 ------------------------------------------------------------------------------ . predict p (option p assumed; Pr(A)) . replace p = 1-p if A==0 (2 real changes made) . gen wt = 1/p . gen newpop = int(wt*pop)
Look at “new” population A L Y pop p wt newpop 1. 0 0 0 10 .5 2 20 2. 0 0 1 40 .5 2 80 3. 1 0 0 30 .5 2 60 4. 1 0 1 20 .5 2 40 5. 0 1 0 16 .1 9.999998 159 6. 0 1 1 24 .1 9.999998 239 7. 1 1 0 252 .9 1.111111 280 8. 1 1 1 108 .9 1.111111 120
Association of A and L in old and new population . cs A L [freq=pop] | L | | Exposed Unexposed | Total -----------------+------------------------+---------- Cases | 360 50 | 410 Noncases | 40 50 | 90 -----------------+------------------------+---------- Total | 400 100 | 500 Risk | .9 .5 | .82 | | | Point estimate | [95% Conf. Interval] |------------------------+---------------------- Risk ratio | 1.8 | 1.475633 2.195669 +----------------------------------------------- chi2(1) = 86.72 Pr>chi2 = 0.0000 . cs A L [freq=newpop] | L | | Exposed Unexposed | Total -----------------+------------------------+---------- Cases | 400 100 | 500 Noncases | 398 100 | 498 -----------------+------------------------+---------- Total | 798 200 | 998 Risk | .5012531 .5 | .501002 | | | Point estimate | [95% Conf. Interval] |------------------------+---------------------- Risk ratio | 1.002506 | .8586389 1.170479 +----------------------------------------------- chi2(1) = 0.00 Pr>chi2 = 0.9747
Association of A and Y in new population . cs Y A [freq=newpop], or | A | | Exposed Unexposed | Total -----------------+------------------------+---------- Cases | 160 319 | 479 Noncases | 340 179 | 519 -----------------+------------------------+---------- Total | 500 498 | 998 | | Risk | .32 .6405622 | .4799599 | | | Point estimate | [95% Conf. Interval] |------------------------+---------------------- Risk difference | -.3205622 | -.3792806 -.2618439 Risk ratio | .4995611 | .4326862 .576772 Prev. frac. ex. | .5004389 | .423228 .5673138 Prev. frac. pop | .2507209 | Odds ratio | .2640605 | .2031715 .3431976 (Cornfield) +----------------------------------------------- chi2(1) = 102.72 Pr>chi2 = 0.0000
Diarrhea among HIV+ patients • Of interest was the contribution of medication to the prevalence of diarrhea among AIDS patients. • The assumption was that the remainder of the diarrhea was caused by pathogens. • So, the parameters of interest were P(Ya=1), a represents the levels of medication, and Ya = 1 if patient has diarrhea, 0 otherwise.
Step 1: Choosing Marginal Model • First, one must choose a model for the marginal treatment (risk) probabilities. • In this case, the outcome, Y, is binary (diarrhea) and the risk variable of interest, A, is categorical (medical risk, 4 levels: very low, low, medium and high). • What we want is a model that will describe the marginal risk of diarrhea for each of these 4 levels.
Step 1, cont. • One choice is: log(px/(1- pa)=0+ 1a1+ 2 a2 + 3a3 • a1 - a3 are dummy variables representing the levels of medical risk. • a1=1 if A=low (0 otherwise), a2=1 if A=medium, and a3 =1 if A = high.
Step 1, cont. • So, p0 = 1/(1+exp(-(0))) = probability of diarrhea if everyone had level 0 of medication (lowest risk) or P(Y0=1) • p3 = 1/(1+exp(-(0+3))) = probability of diarrhea if everyone had level 3 of medication (highest risk) or P(Y3=1).
Step 2: Choosing confounders. • This study has the possibility of confounding because patients with more advanced illness are both given medications with higher risk of diarrhea and suffer from greater chance of diarrhea from infection. Concern Boiled/bottled Diarrhea CD4 Med. risk
Step 3: Adjusting for confounders by modeling probability of treatment. • Let W be the list of variables that, based on causal graph, one believes confounds the causal effect of A on Y. • In the diarrhea example, W is CD4 count. • MSM works (adjusts the estimates) by including estimated sampling weights which are the 1/ P(A|W=w).
Modeling probability of treatment, X. • In our case, A is a categorical variable with four levelsand W is continuous. • One way to model P(A|W=w) is with multinomial logistic regression:
Modeling P(A=a | W) in Stata . mlogit medcat cd4, basecategory(0) Multinomial regression Number of obs = 211 chi2(3) = 1.97 Prob > chi2 = 0.5780 Log Likelihood = -238.54152 Pseudo R2 = 0.0041 ------------------------------------------------------------------------------ medcat | Coef. Std. Err. z P>|z| [95% Conf. Interval] ---------+-------------------------------------------------------------------- 0.07-0.21| cd4 | -.0008203 .0012283 -0.668 0.504 -.0032277 .0015871 _cons | .8739337 .5995797 1.458 0.145 -.3012209 2.049088 ---------+-------------------------------------------------------------------- 0.21-0.43| cd4 | -.0008316 .0010207 -0.815 0.415 -.002832 .0011688 _cons | 2.28173 .5122226 4.455 0.000 1.277792 3.285668 ---------+-------------------------------------------------------------------- > 0.43 | cd4 | -.0015786 .0011637 -1.356 0.175 -.0038595 .0007023 _cons | 1.63735 .556692 2.941 0.003 .5462543 2.728447 ------------------------------------------------------------------------------ (Outcome medcat== < 0.07 is the comparison group)
Getting Estimates of 1/P(A=a|W) . predict p1 p2 p3 p4, p . gen pwght=1/p1 . replace pwght = 1/p2 if medcat==2 . replace pwght = 1/p3 if medcat==3 . replace pwght = 1/p4 if medcat==4
Get the probabilties for above model . cd4 diarrhea p1 p2 p3 p4 1. 794 0 .1139346 .1422799 .5684277 .1753577 2. 200 0 .0663043 .1348798 .5329911 .2658248 3. 430 0 .0824113 .1387831 .550747 .2280587 4. 415 1 .0812754 .1385672 .5497382 .2304192 5. 716 0 .1065159 .1418175 .5657657 .1859009 6. 213 0 .0671422 .1351335 .5341216 .2636027 7. 174 1 .0646534 .1343609 .5306862 .2702994 8. 310 0 .0736634 .1369031 .5420853 .2473482 9. 264 1 .0705111 .1360912 .5384135 .2549842 10. 9 0 .0549289 .1307218 .5147436 .2996057 11. 436 1 .0828691 .1388679 .5511445 .2271186 12. 51 0 .0572841 .1317035 .5190113 .2920011 13. 705 0 .1054997 .1417395 .5653399 .1874209 14. 579 0 .0943769 .1406234 .5595861 .2054137 15. 437 1 .0829456 .1388819 .5512104 .2269621 16. 848 0 .1192923 .1425067 .5699013 .1682997 17. 196 0 .0660481 .134801 .5326403 .2665106 18. 218 0 .0674667 .13523 .5345525 .2627507 19. 928 0 .1275697 .1427017 .5715237 .158205 20. 486 . .0867616 .1395399 .5543227 .2193758
Step 4: Do probability weighted regression. • For each individual, create weights: • This has the effect (sort of) of adding many observations when the estimated probability is low and few if the probability is high.
Step 4, cont. Confounding as Sampling Bias • One can think of confounding as a form of sampling bias. • Consider the study of a treatment for AIDS patients where the physicians considers the health of the patients when deciding the Tx to prescribe. • By reweighting the sample, based on the probability of being sampled on factors related to the health, one gets a sample evenly distributed with respect to variables that affect the outcome.
Doing this for the Diarrhea Data logit diarrhea a1 a2 a3 [pweight=pwght] Logit Estimates Number of obs = 210 chi2(3) = 4.76 Prob > chi2 = 0.1900 Log Likelihood = -140.46701 Pseudo R2 = 0.0269 ------------------------------------------------------------------------------ | Robust diarrhea | Odds Ratio Std. Err. z P>|z| [95% Conf. Interval] ---------+-------------------------------------------------------------------- a1 | 1.279149 .8527155 0.369 0.712 .3463273 4.724494 a2 | 1.612001 .9248658 0.832 0.405 .5235987 4.962857 a3 | 2.867675 1.765869 1.711 0.087 .857775 9.58708 ------------------------------------------------------------------------------ Note pwght is
Comparing no adjustment to MSM Estimates of P(Ya=1) and OR’s assuming no confounding and adjusted for CD4 count using MSM. Assuming No ConfoundingMSM Medical Risk OR(95% CI) P(Ya=1) OR(95% CI) P(Ya=1) <0.07 1(ref.) 0.29 1(ref.) 0.34 0.07-0.21 1.55(0.43,5.64) 0.39 1.27(0.35,4.72) 0.40 0.21-0.43 1.98(0.65,5.99) 0.45 1.61(0.52,4.96) 0.45 >0.43 3.60(1.10,11.80) 0.60 2.87(0.86,9.59) 0.60
Other Data Types • Can apply this general methodology to any regression scenario (linear, Cox regression, etc.). • This was a very simple situation, but can also incorporate type dependent covariates. • Almost always one can do with existing software, as long as program allows user-supplied regression weights.