Download
1 / 26
260 likes | 419 Vues
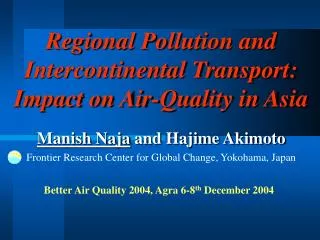
Regional Pollution and Intercontinental Transport: Impact on Air-Quality in Asia. Manish Naja and Hajime Akimoto Frontier Research Center for Global Change, Yokohama, Japan. Better Air Quality 2004, Agra 6-8 th December 2004. Sources -.

E N D
Regional Pollution and Intercontinental Transport: Impact on Air-Quality in Asia Manish Naja and Hajime Akimoto Frontier Research Center for Global Change, Yokohama, Japan Better Air Quality 2004, Agra 6-8th December 2004
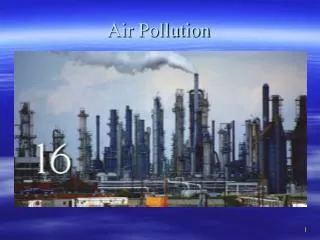
Sources - Un-complete combustion e.g. Automobile exhaust, Industrial, home cooking 124 ppbv 84 ppbv violating the EPA air-quality standard in the USA USA population 291 millions (2003) Air-Pollution An Old Problem - • First signature of urban pollution in 12th century (1135-1204) • Prohibition in selling coal during the sessions of Parliament in London (in 1300s) CO Pb NO2 O3 PM10 PM2.5 SO2 • Influences - • Health(eye irritation, respiratory diseases, • asthma, etc.) • Vegetations • Visibility Reduction(Smog/haze) • Change in Oxidizing Capacity • Radiative Balance
A free-air ozone exposure system Ozone reduces transpiration and raises vegetation temperature Photo courtesy of S.P. Long
Total Tropospheric Ozone Population NOx (NO+NO2) Fishman et al., ACP 2003 Asian NOx Emission (LPS)- Naja et al., JGR 2003; Akimoto, Science 2003 Source: G. Carmichael and D. Streets Status of Pollutants
Observations in INDIA CO + OH + O2 HO2 + CO2 HO2 + NO NO2 + OH NO2 + O2 + hn O3 + NO (l<410 nm) HO2 + O3 OH + 2O2 Processes Controlling Tropospheric O3 Strat.-Trop. Exchange CO, O3 HO2 Or RO2 hν hν NMHCs, CH4, CO O3 OH O+O2 NO2 OH HO2 H2O Deposition O3 > 10 pptv NO Emissions
Issues: • Estimate of contributions from Regional Pollution • Information of background ozone levels • Whether changes in the emission levels are consistent • with changes in ozone However, these studies are limited to model simulations and few Air-craft campaigns for limited periods. Tools and Methodology: • Ozone from sondes data • - Japan, USA, Europe (1970-2003) • Boundary layer (950-750 hPa) • Lower troposphere (750-550 hPa) • Back-Air Trajectories • 10 days back ward • 1500m and 3000m • Classification of Air masses • Sectors and Residence time
Europe 15-21% Eurasia 41-42% USA 25-34% East Asia 17-50% Approach:
Ozonesonde data - Japan Tsukuba Kagoshima Regionally Polluted Regionally Non-Polluted(Background) Naja and Akimoto, JGR 2004
With Trajectory 1986-2002 1970-1985 Influence of Regional Pollution Press release in Tokyo, Japan on 6th December 2004 Naja and Akimoto, JGR 2004
Seasonal variations Ozone Build-up Ozonesonde data - Europe 4-6 days = Regionally Polluted Ozone0 Day (Atlantic Air) = Background Ozone Naja et al., JGR 2003; Wild et al., JGR 2004
……. changes in recent years USA, East Asia, and Europe 1970-1989 USA up to -0.3 ppbv yr-1 Europe/East Asia up to 0.86 ppbv yr-1 ….increase over the USA by 0.7-1.94 ppbv yr-1 during 1996-2002 Naja et al., GRL, for submittal
……and changes in CO/NOx and VOC/NOx emissions ratios! CO/NOx VOC/NOx 1987-1998 -2.8% yr-1 -2.3% yr-1 1998-2001 5.0% yr-1 1.7% yr-1
Regionally Polluted Ozone (Surface Ozone) Summer 0.6 - 1.95 ppbv yr-1 Winter - 0.02 - 1.8 ppbv yr-1 Naja and Akimoto, GRL, for submittal
Hot Spots (Fire) Jan 2003 Bio-mass burning: Apr 99 Mar 99 Trajectories Arriving at New Delhi:Contribution from Europe
Significant Contribution from Fires in Southeast Asia (e.g. Thailand and Myanmar) Trajectories arriving from Europe
PRL Site Industries
Conclusions : • We show significant influences of Regional Pollution and its Intercontinental Transport. • Increase of ozone (up to 11 ppbv) in Pacific. • Intercontinental transport from the USA could have • Global influences. • Positive trends in VOC/NOx and CO/NOx emissions ratios over the USA, absence of increasing trend in Regionally Polluted ozone over East Asia, call for rethinking on influences from Asia. • It is essential to have detail studies and quantify the influences of long-range transport to Asia (particularly South Asia).
Surface Ozone Mt Abu Gadanki Ahmedabad Indian Ocean Thumba Naja and Lal, JGR 2003; Naja et al., Atm.Env. 2003
Sources - Un-complete combustion e.g. Automobile exhaust, Industrial, home cooking violating the EPA air-quality standard in the USA 124 ppbv 84 ppbv USA population 291 millions (2003) Air-Pollution An Old Problem - • First signature of urban pollution in 12th century (1135-1204) • Prohibition in selling coal during the sessions of Parliament in London (in 1300s) CO Pb NO2 O3 PM10 PM2.5 SO2 • Influences - • Health(eye irritation, respiratory diseases, • asthma, etc.) • Vegetations • Visibility Reduction(Smog/haze) • Change in Oxidizing Capacity • Radiative Balance
Surface Ozone Mt Abu Gadanki Ahmedabad Indian Ocean Thumba Naja and Lal, JGR 2003; Naja et al., Atm.Env. 2003
Long-term changes – (Europe) Regionally Polluted Ozone Background ozone Naja et al., JGR 2003
PEROXYACETYLNITRATE (PAN) AS RESERVOIR FOR LONG-RANGE TRANSPORT OF NOx